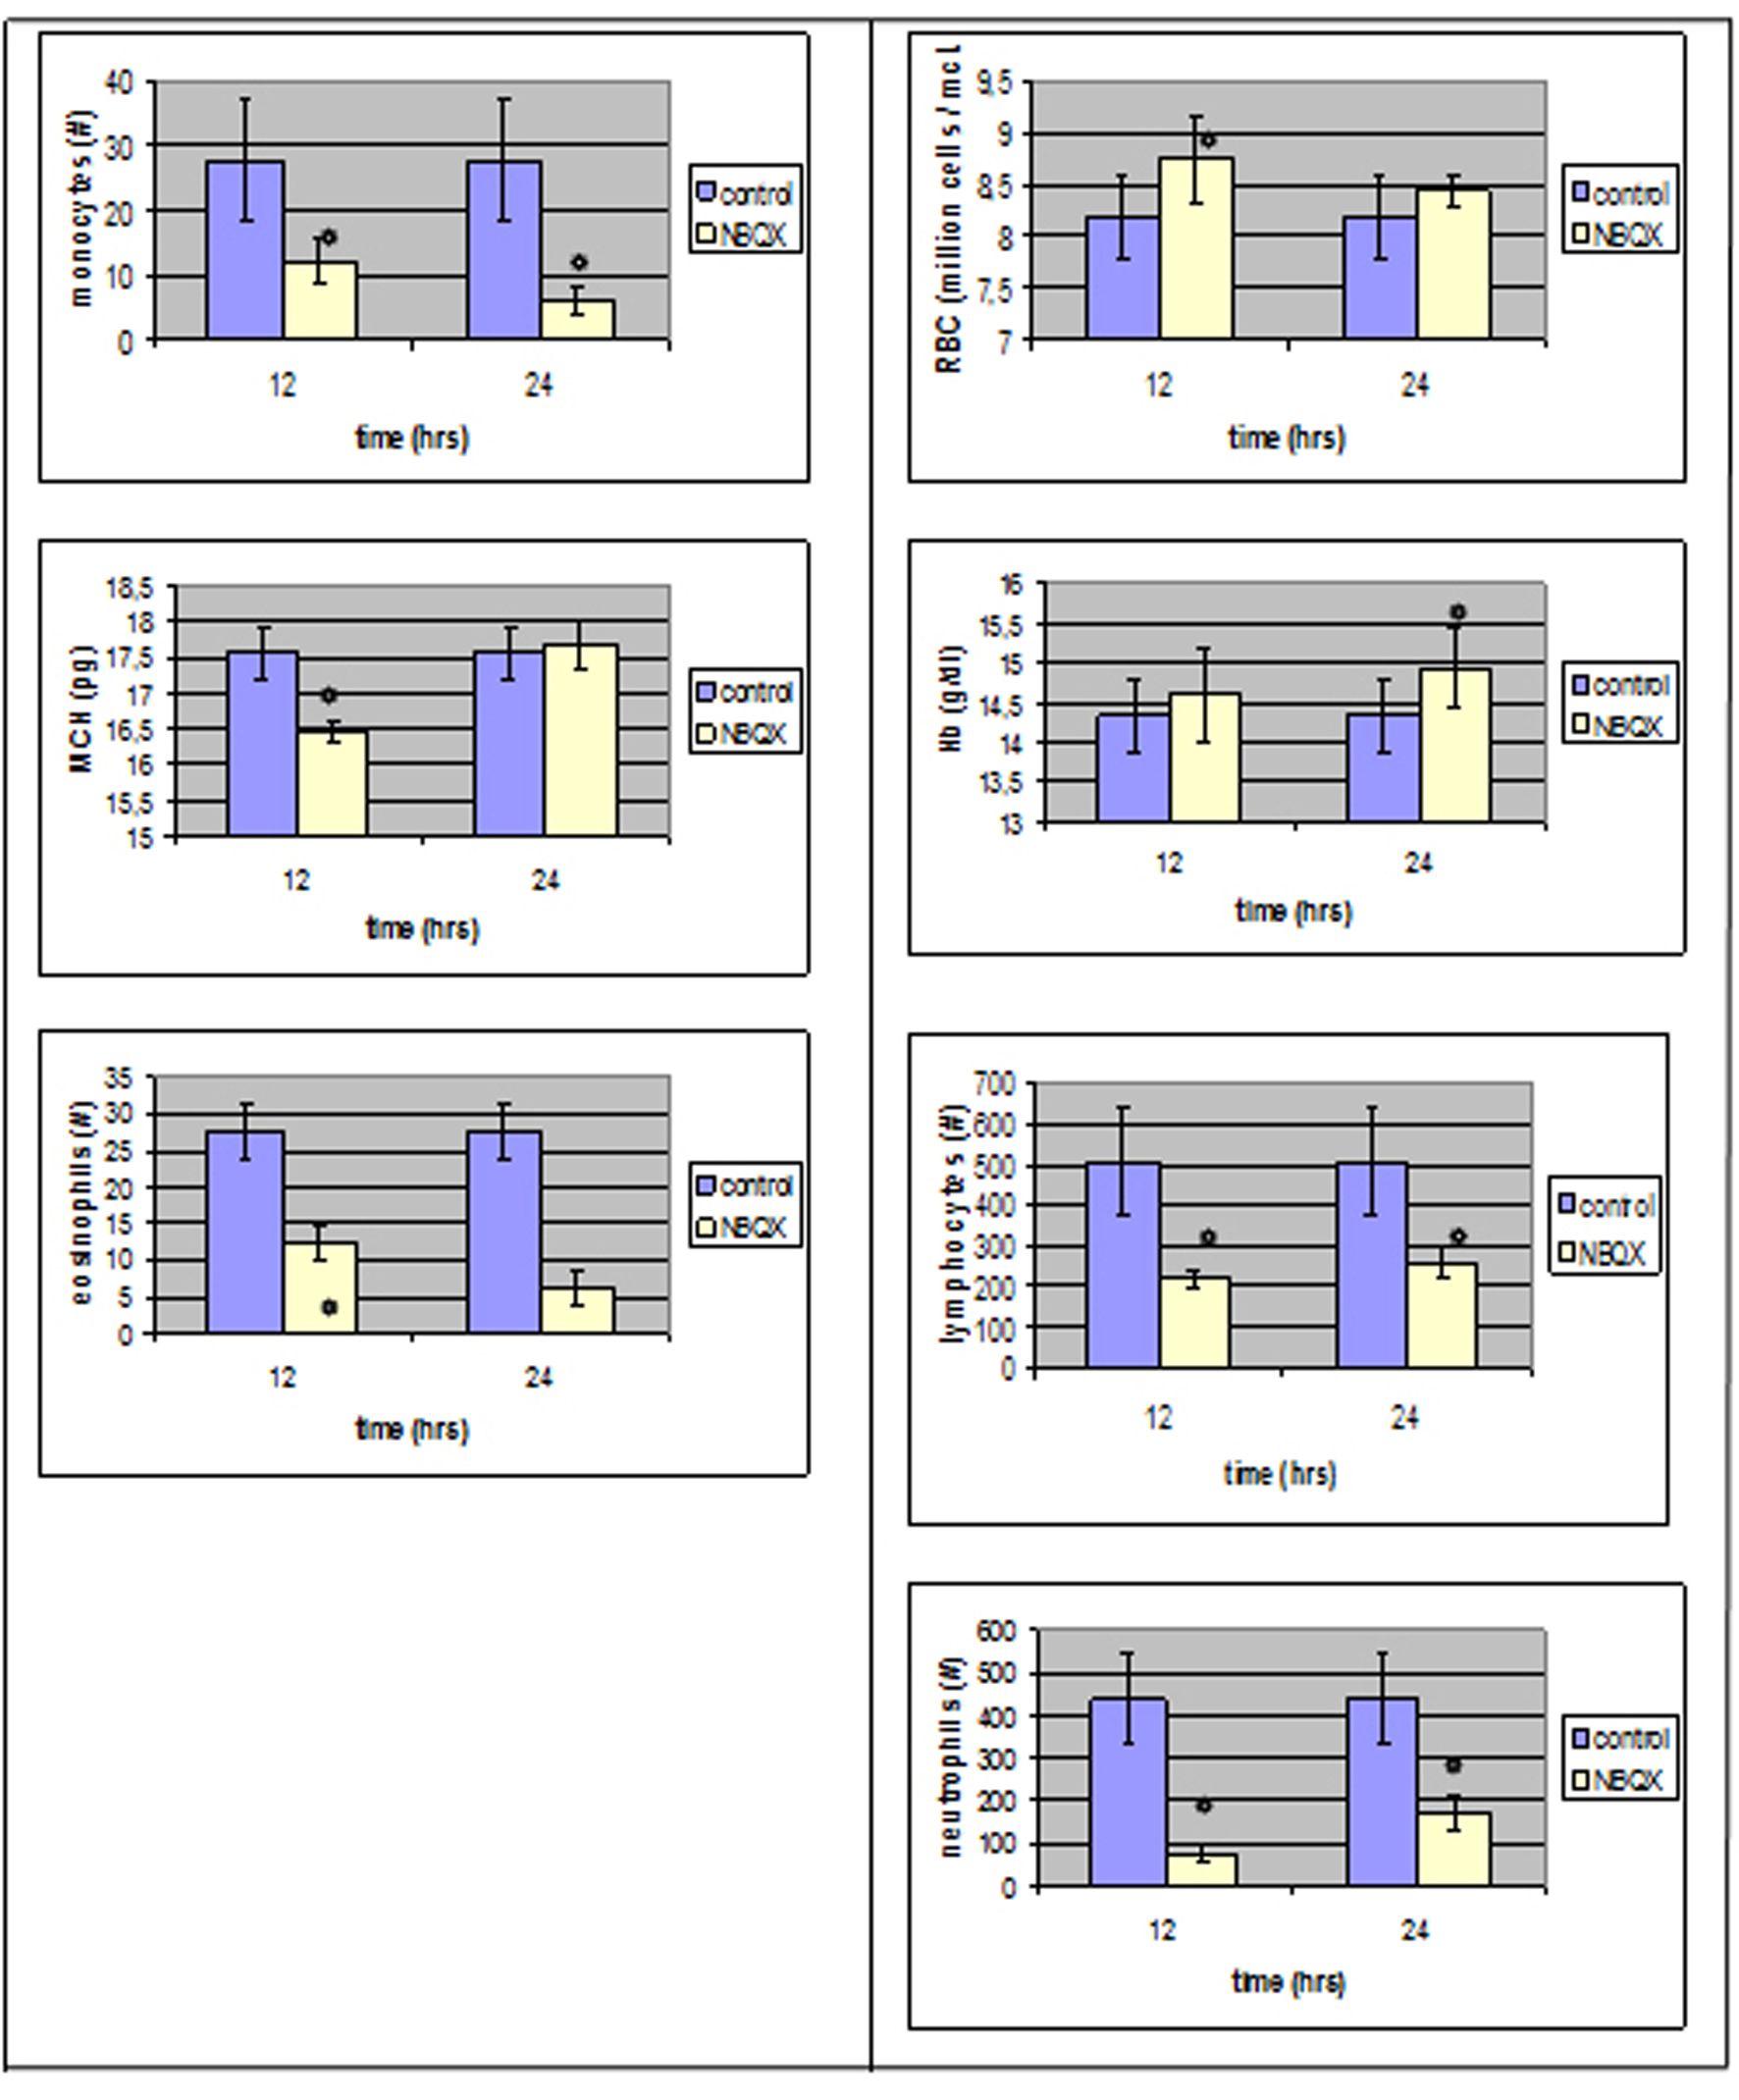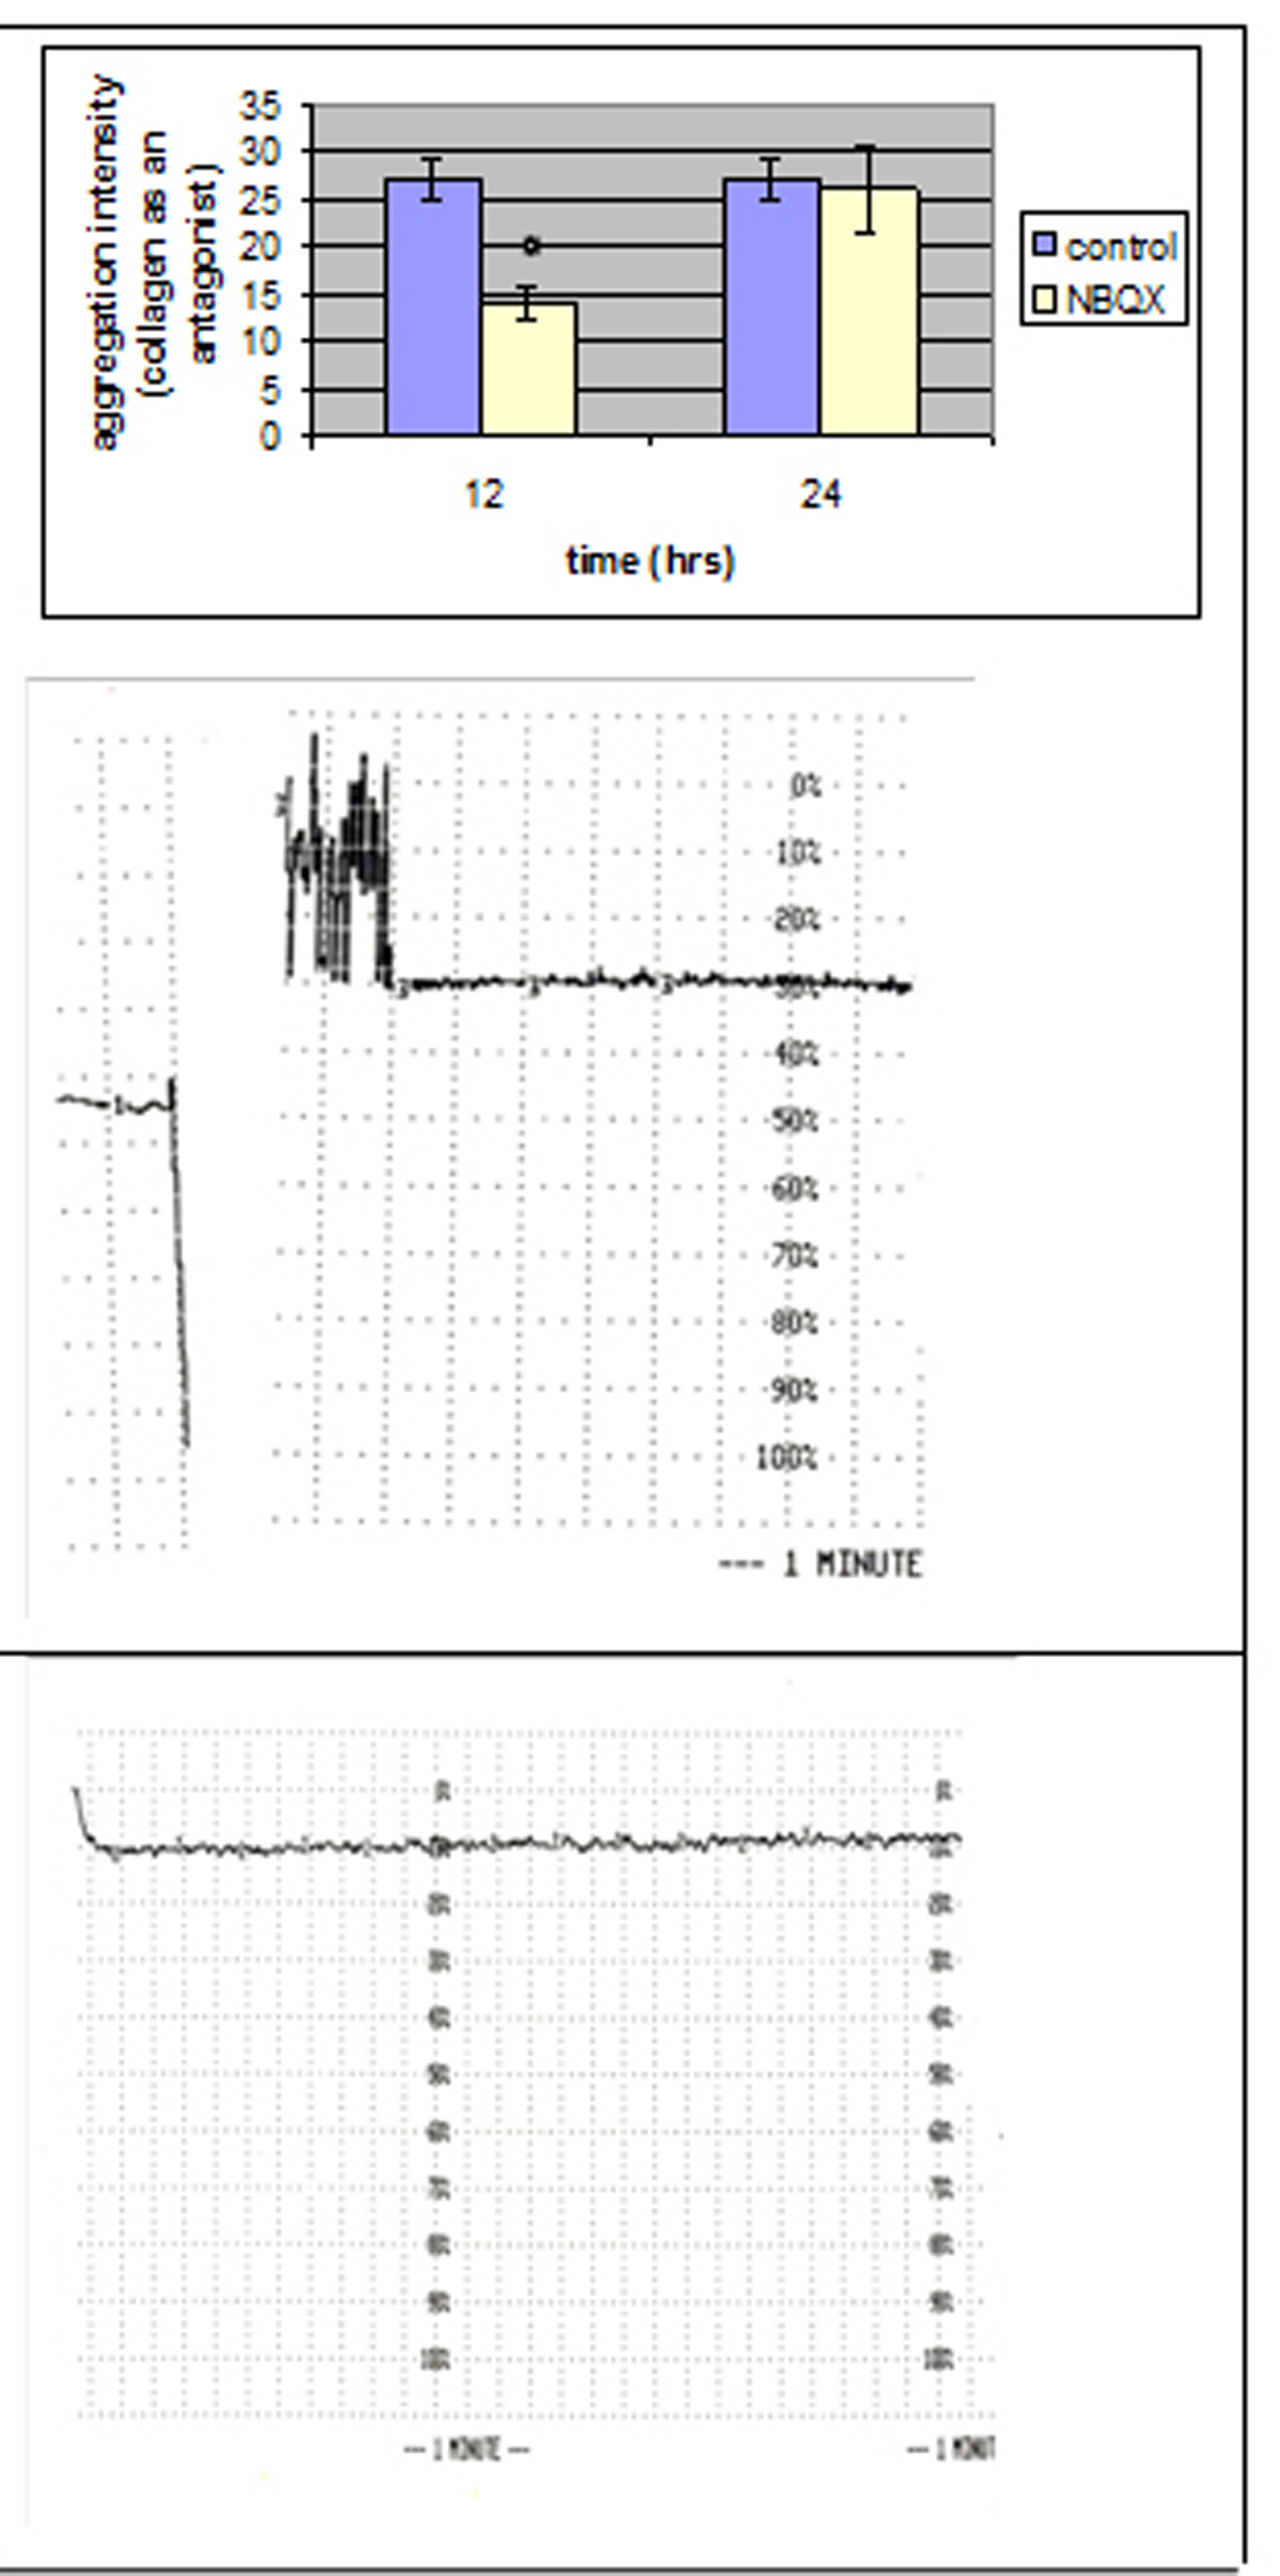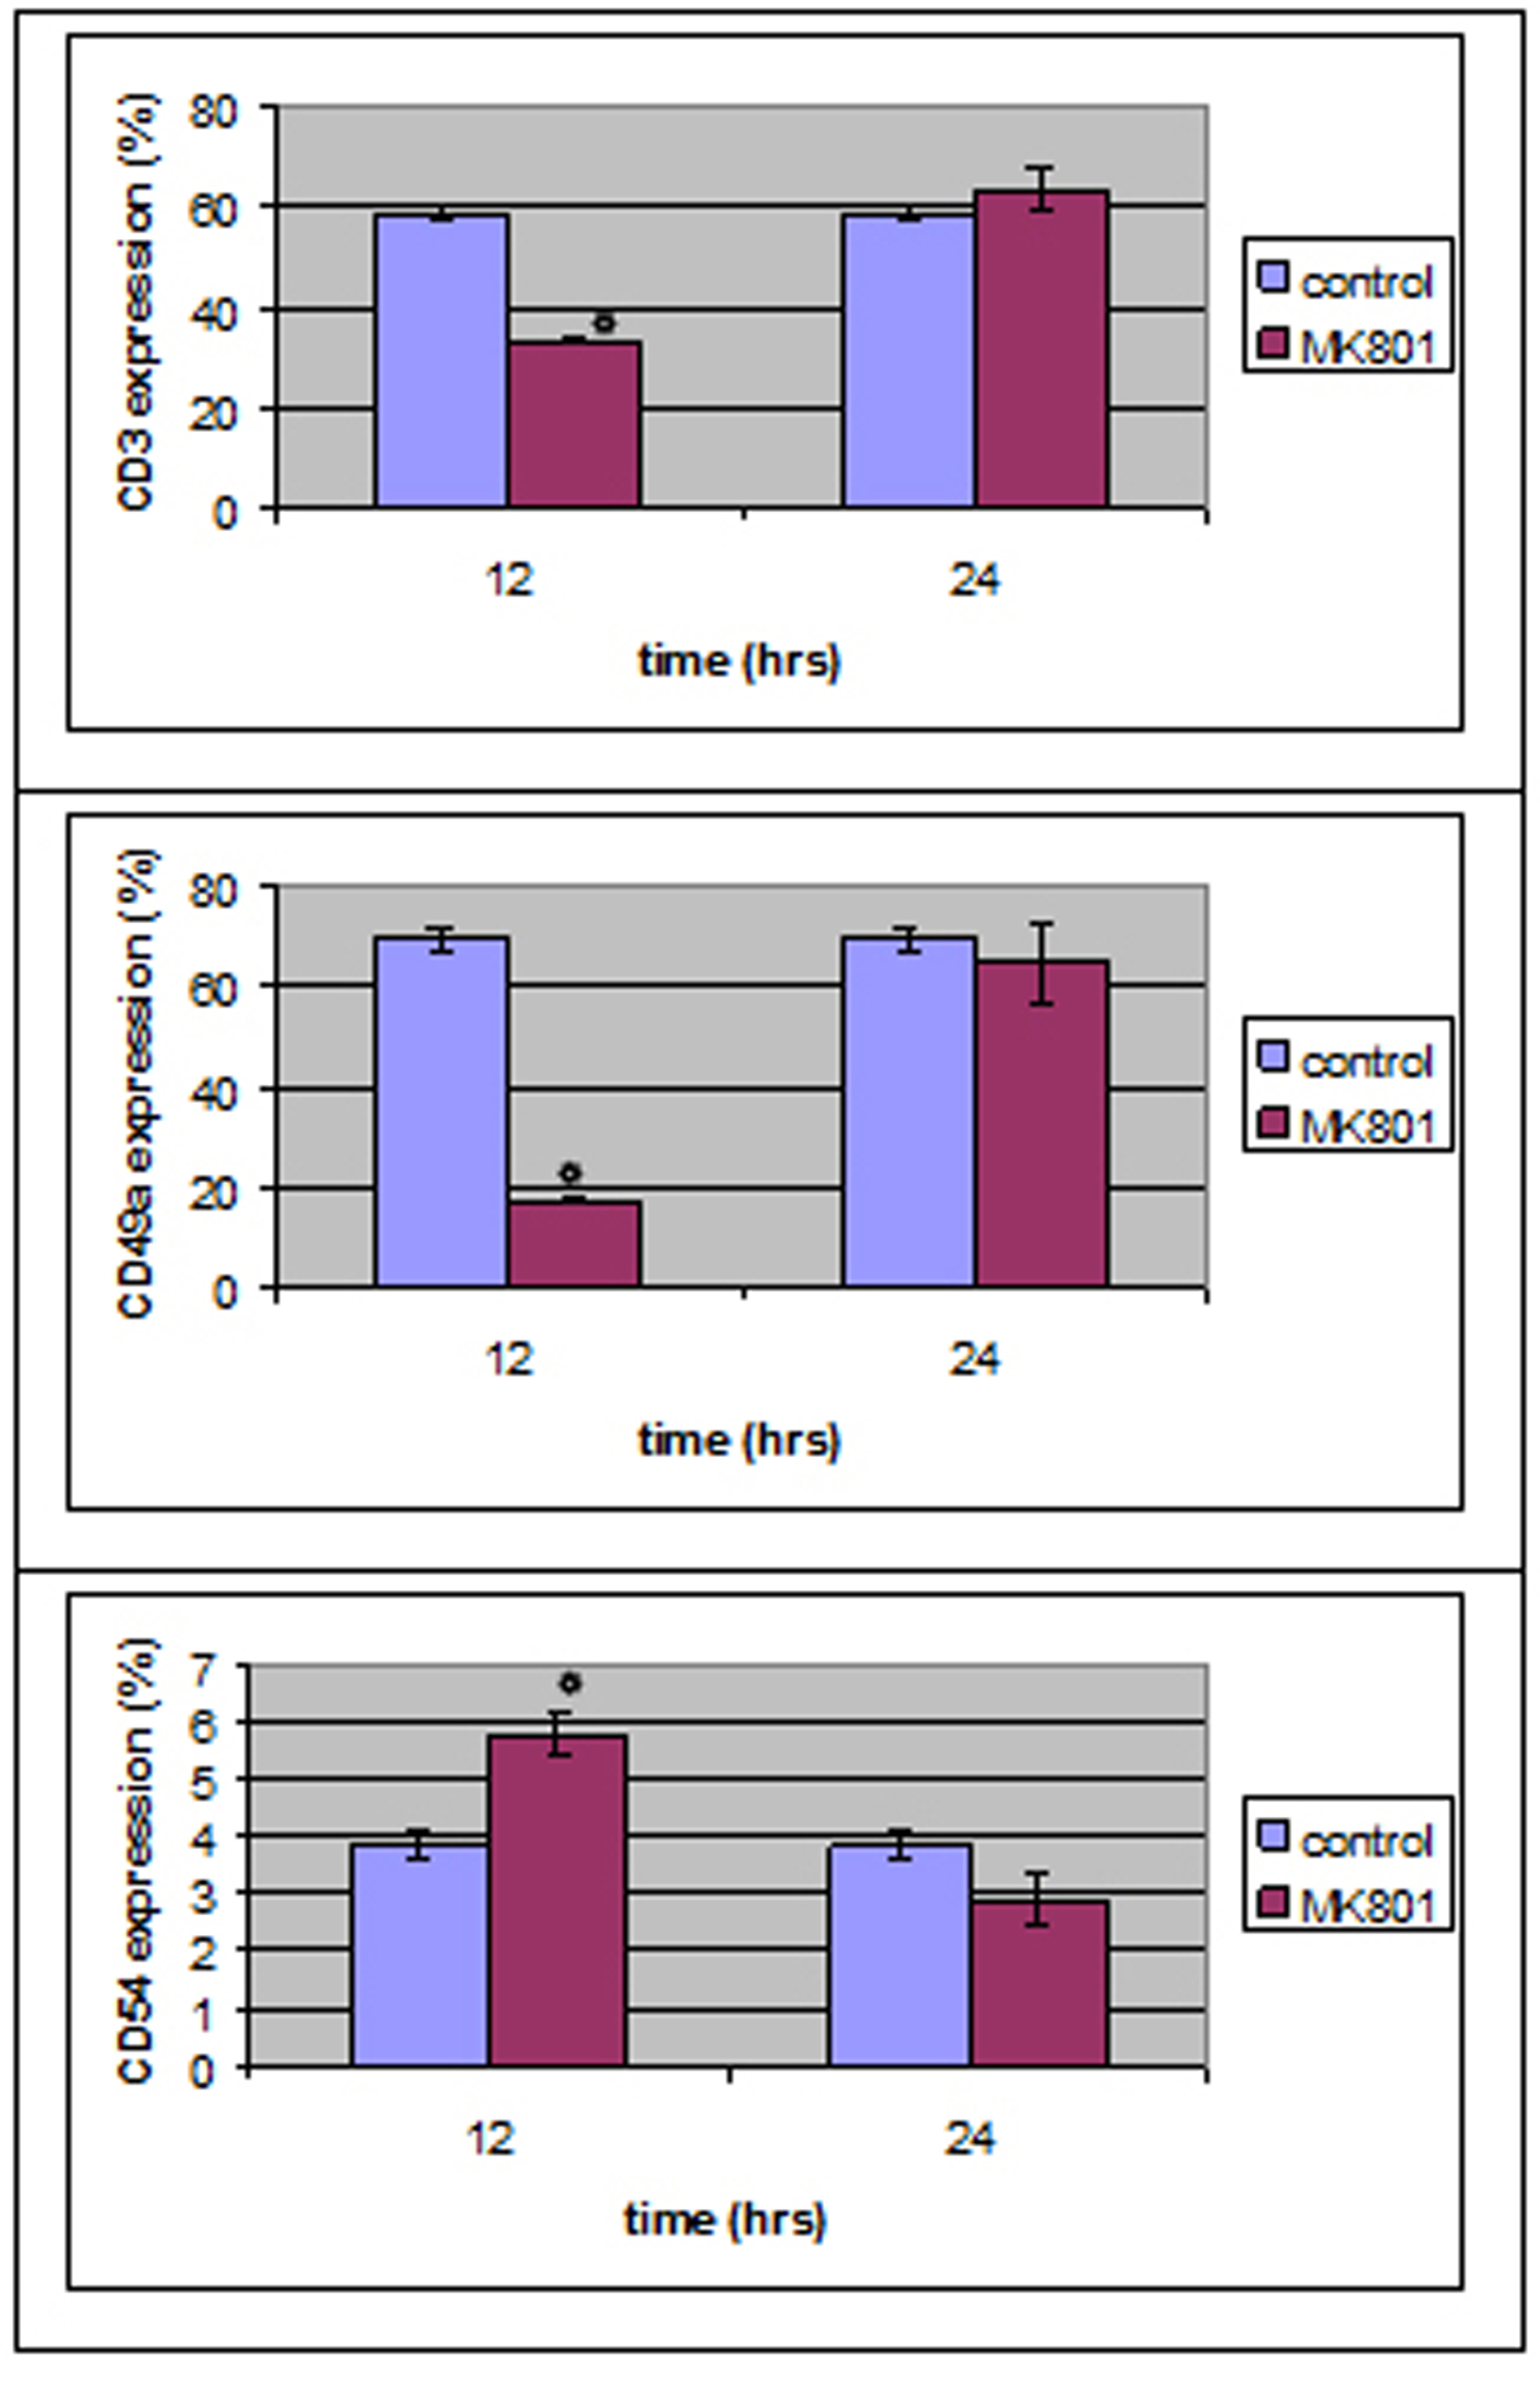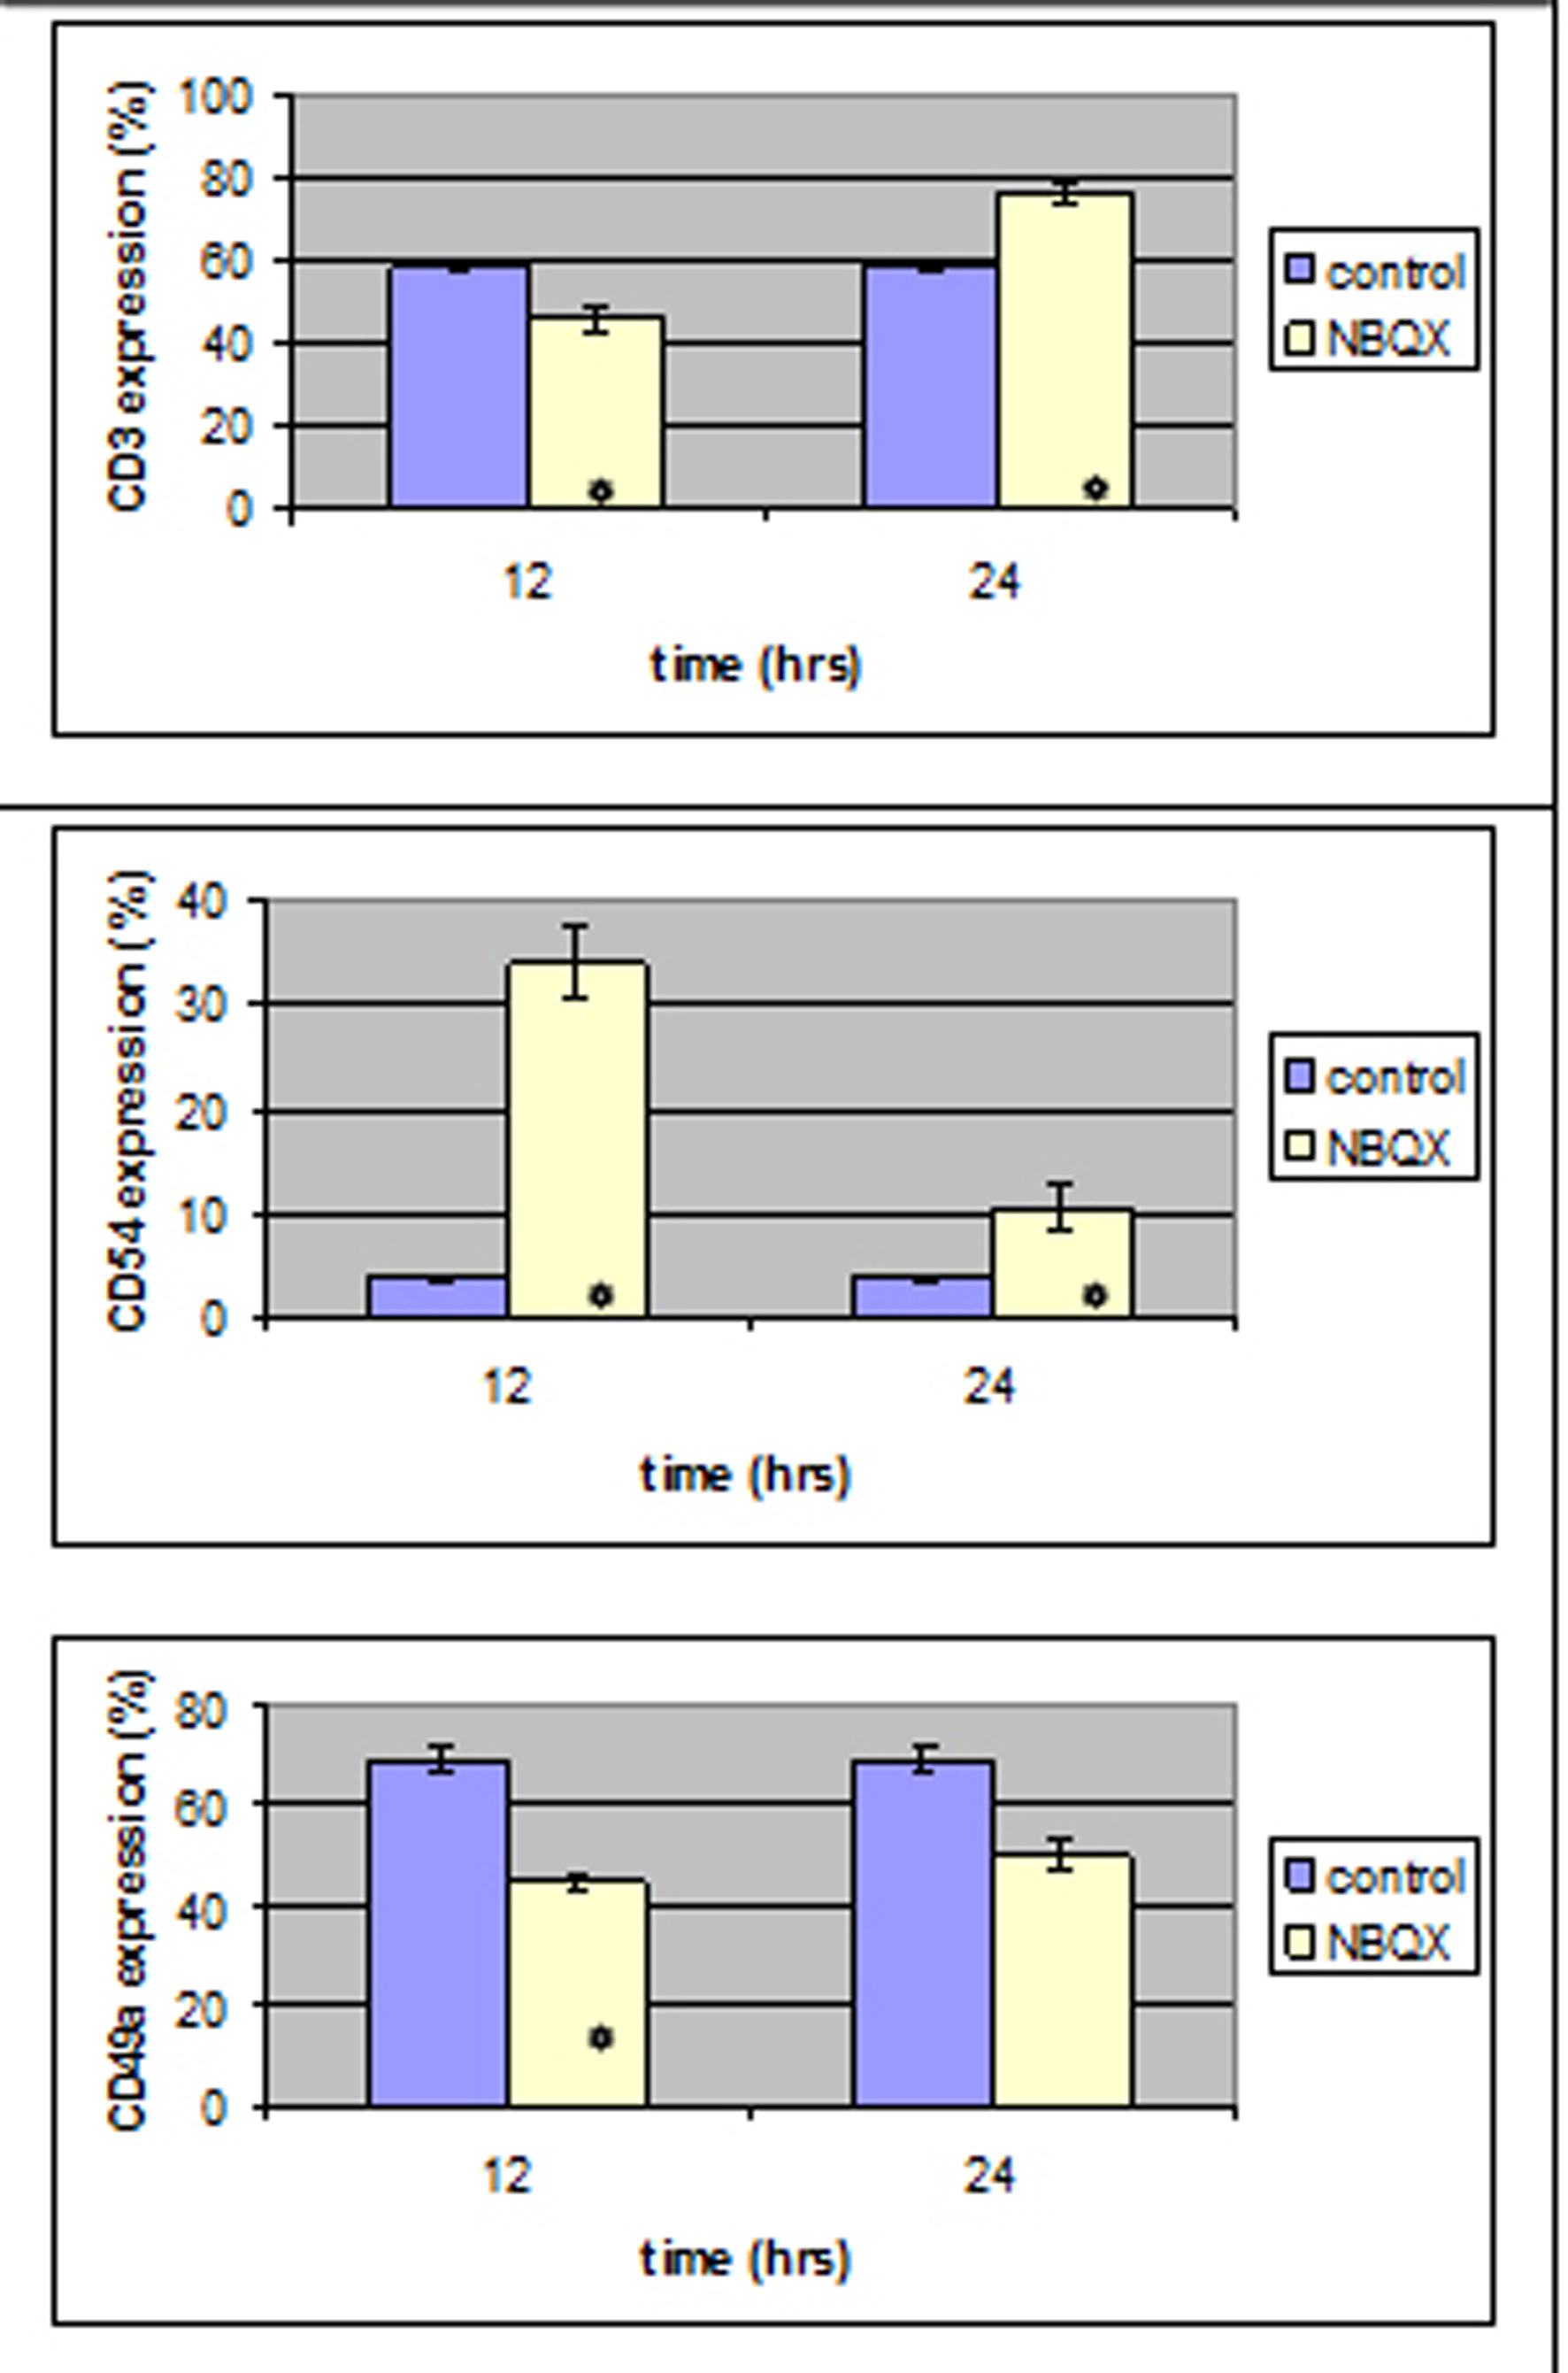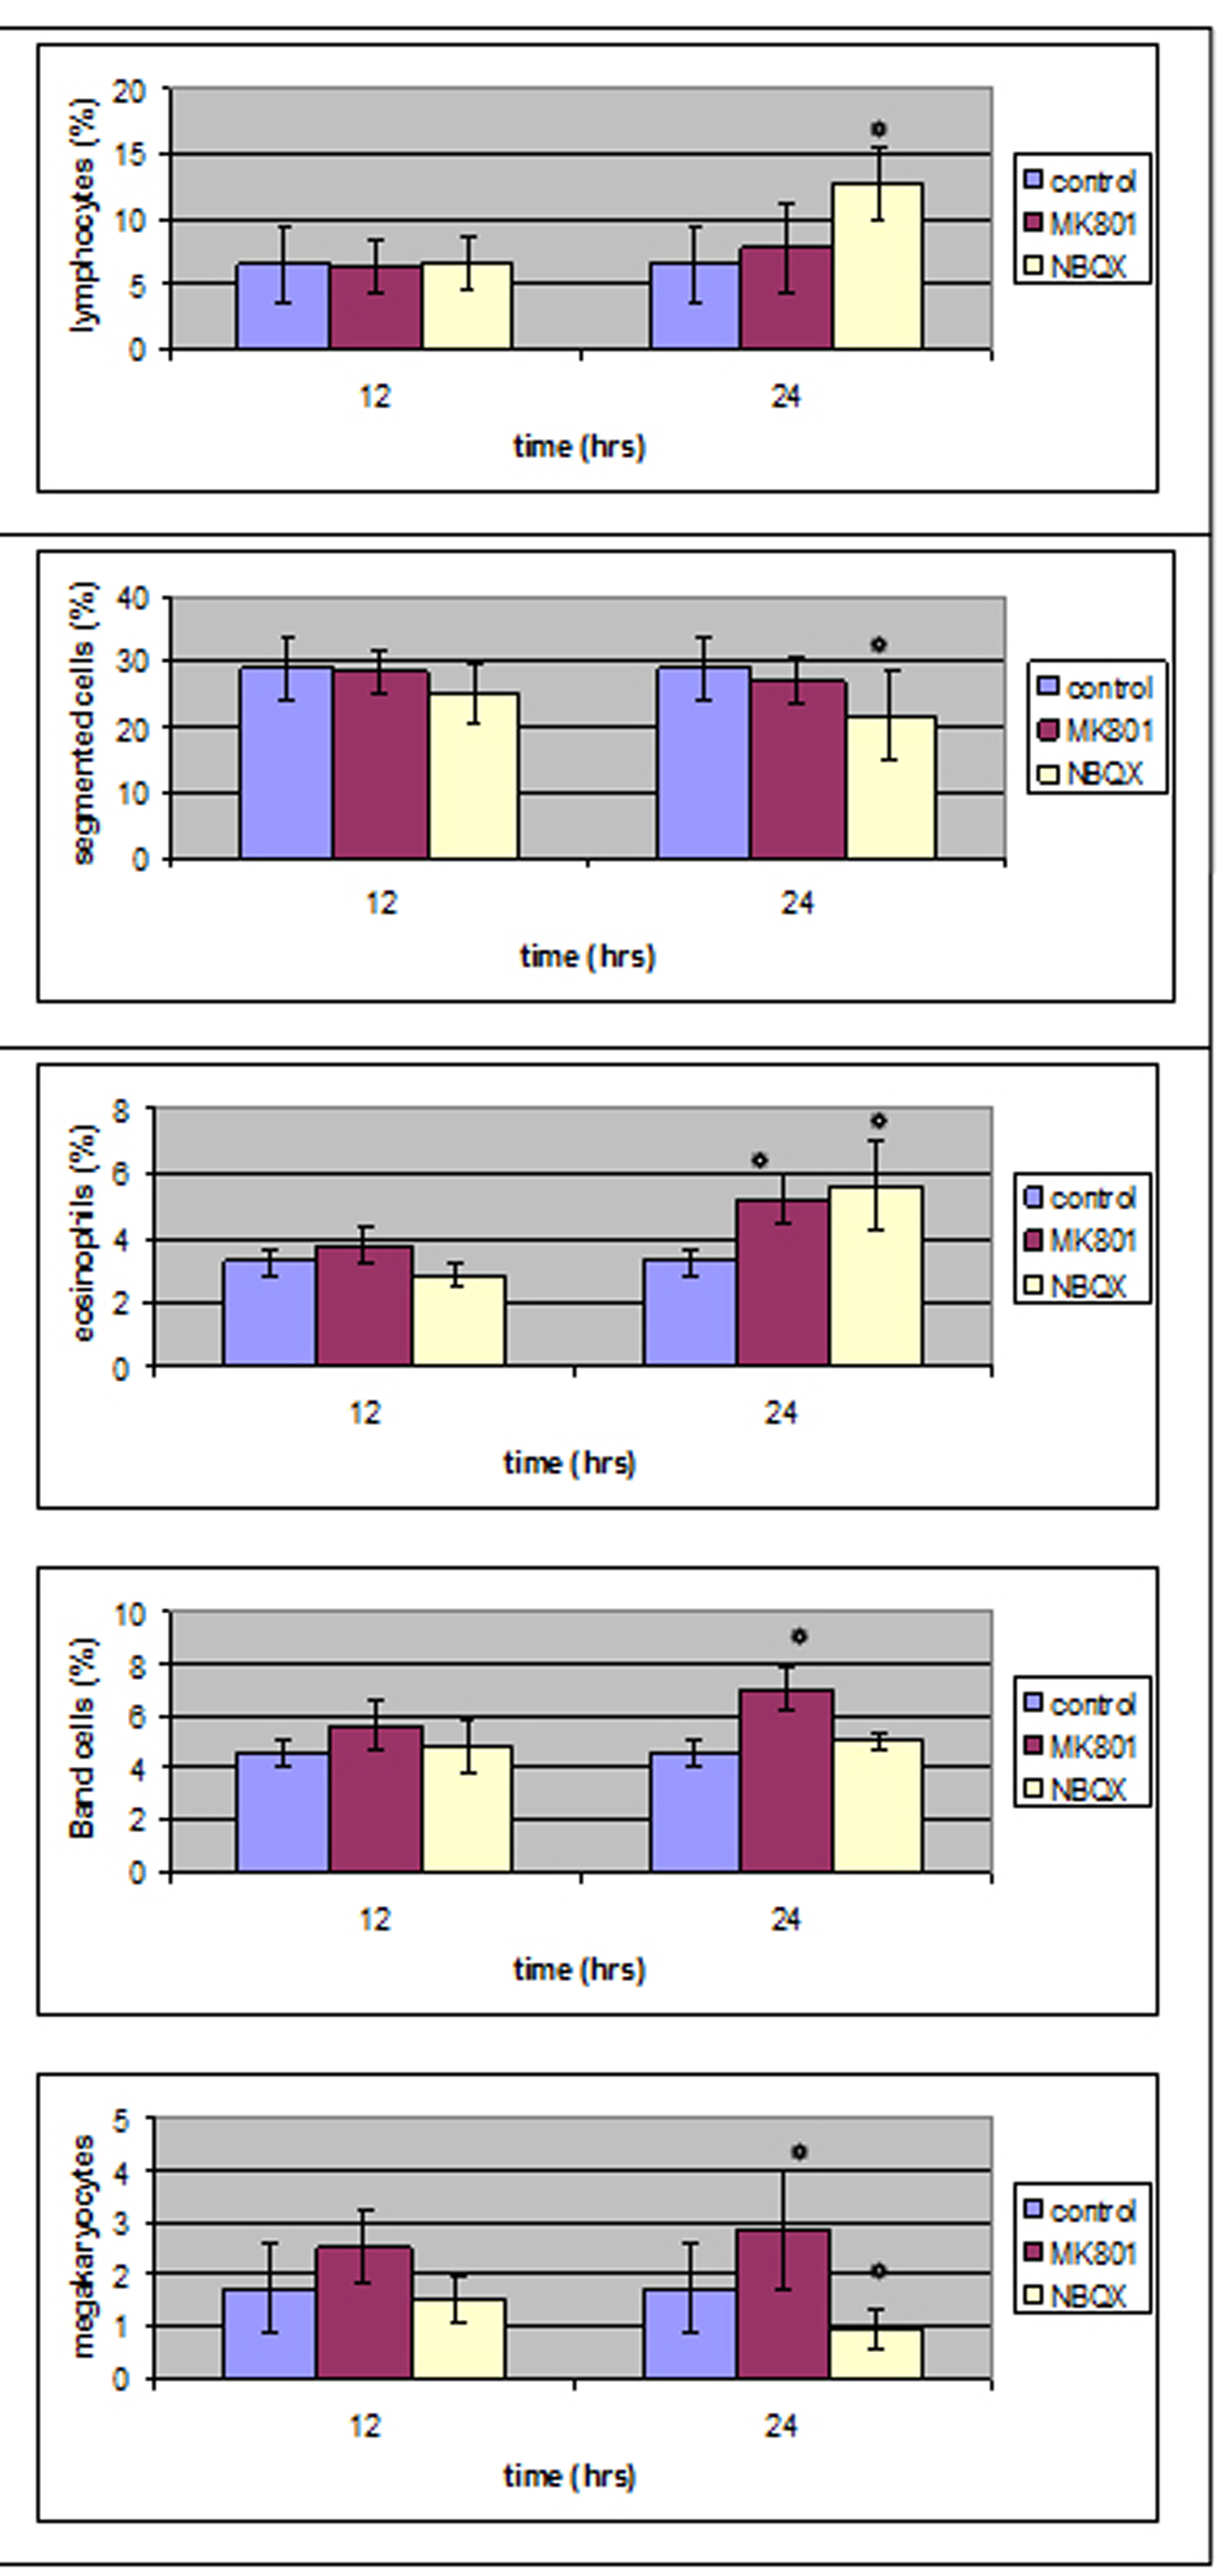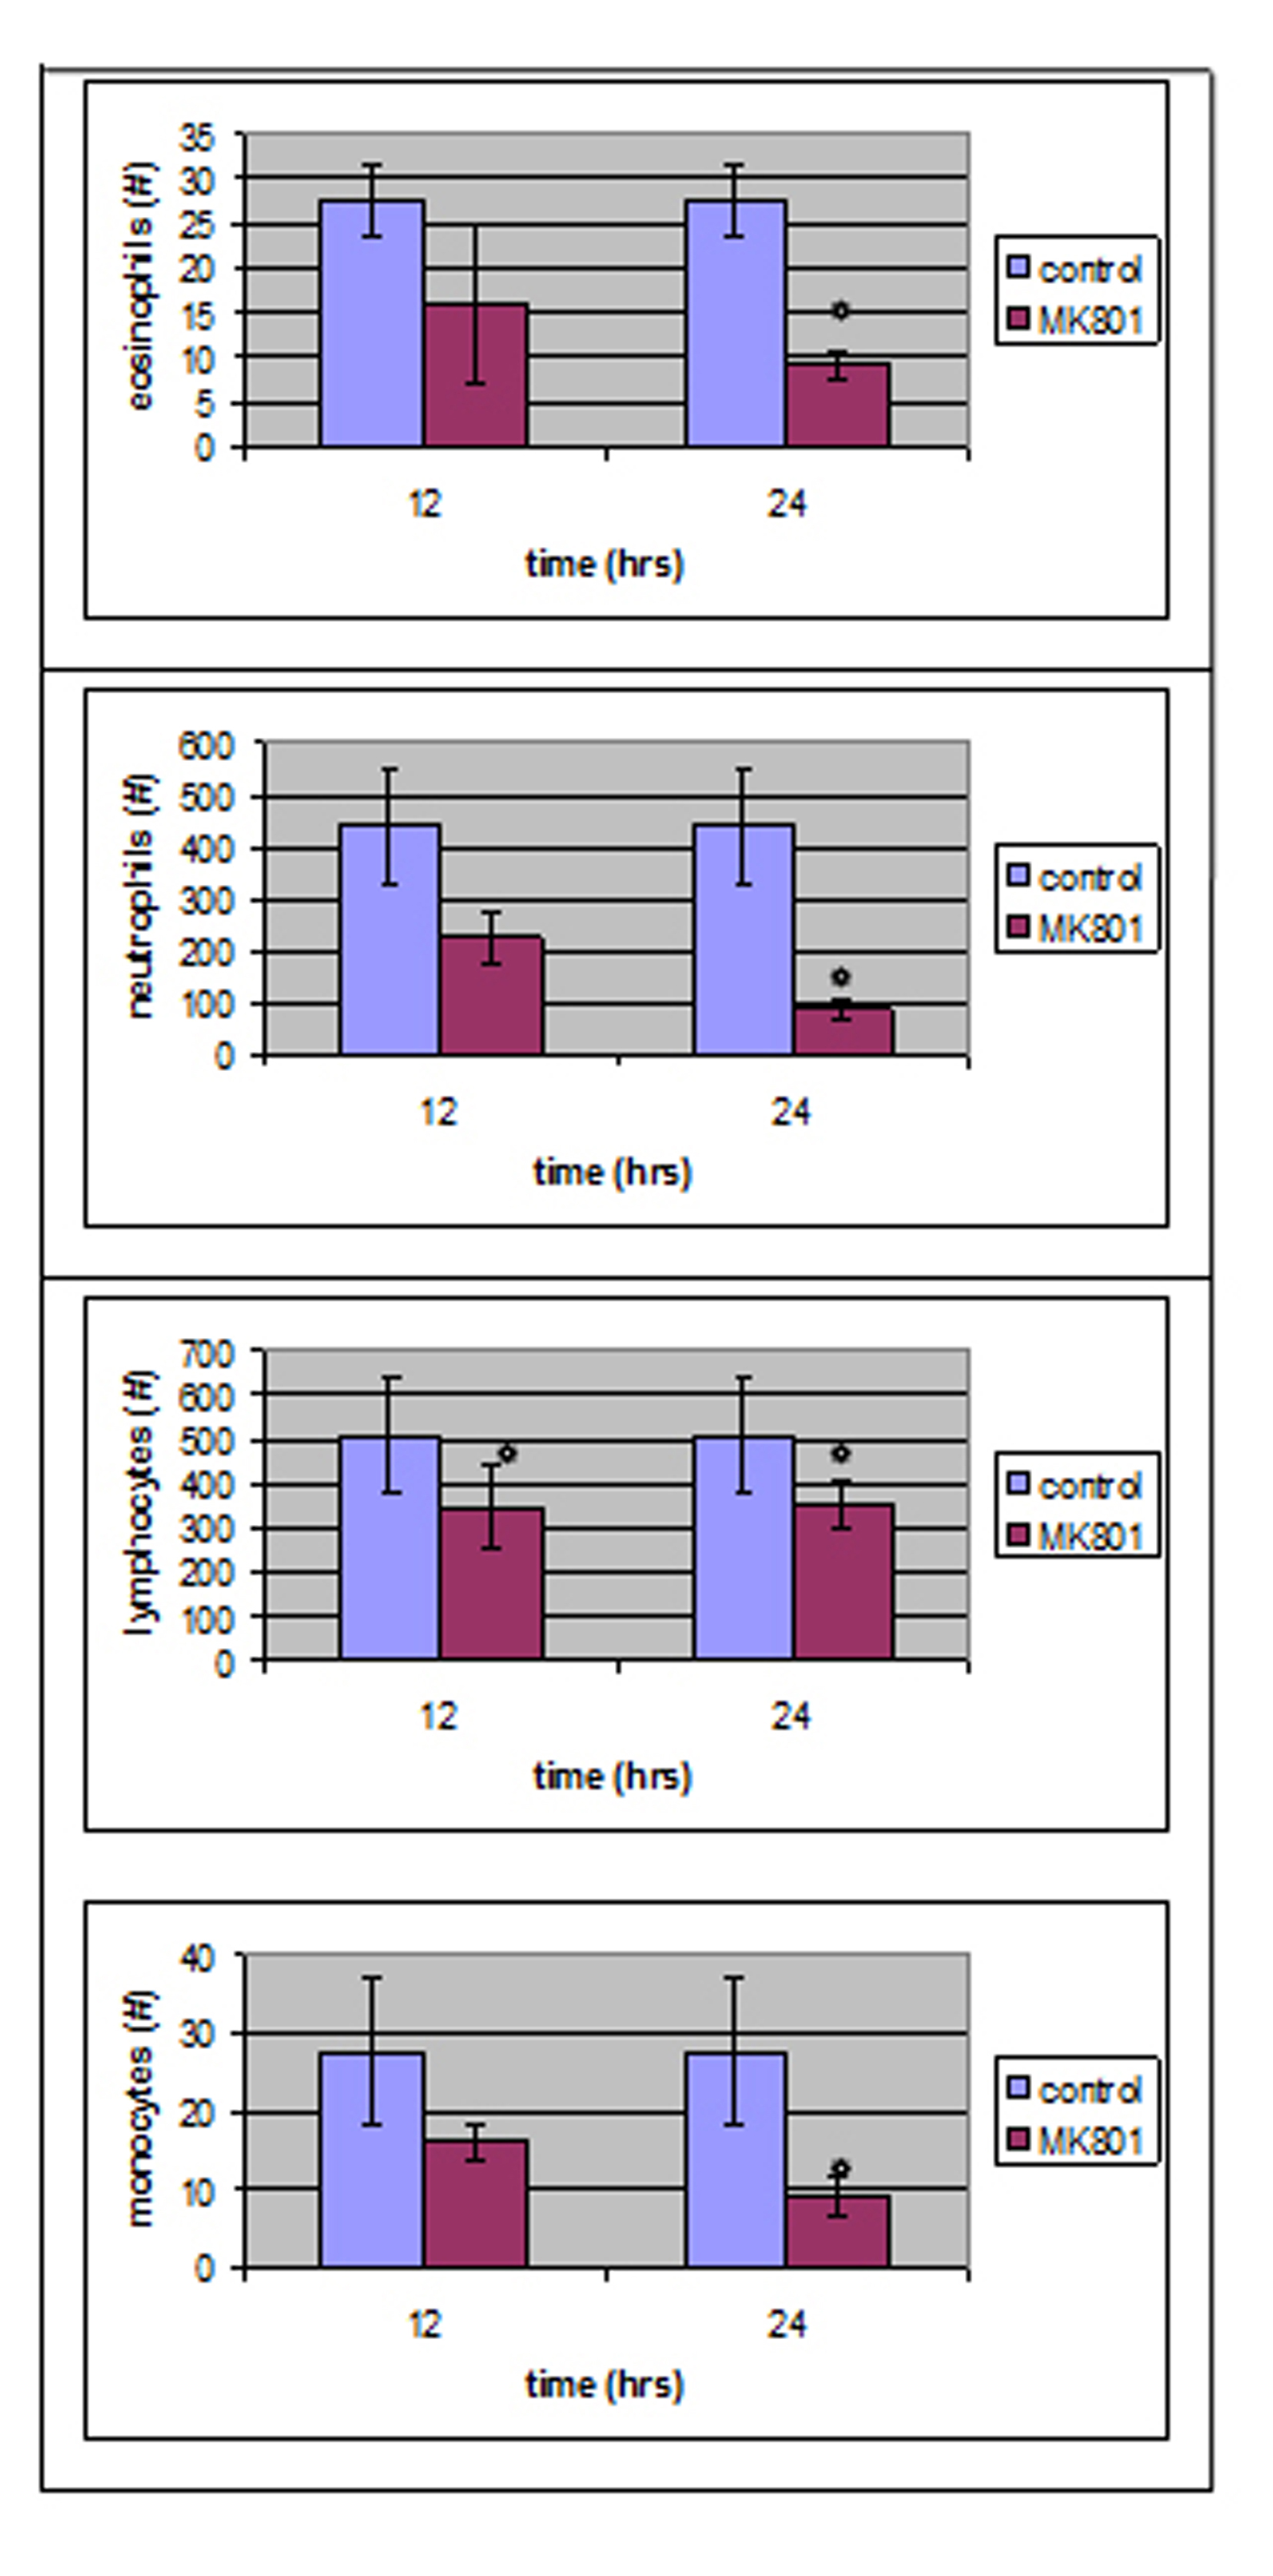
Figure 1. Twelve hours after MK801 administration, only lymphocytes absolute number was statistically different compared to control group whereas, four parameters reached a statistical significant level 24 hours after MK801 administration.
| Journal of Hematology, ISSN 1927-1212 print, 1927-1220 online, Open Access |
| Article copyright, the authors; Journal compilation copyright, J Hematol and Elmer Press Inc |
| Journal website http://www.thejh.org |
Original Article
Volume 1, Number 1, February 2012, pages 1-14
Intravenous Administration of Glutamate Ionotropic Antagonists in Healthy Rats, Induces Lymphopenia and Affects Their Hematological Profile
Figures

