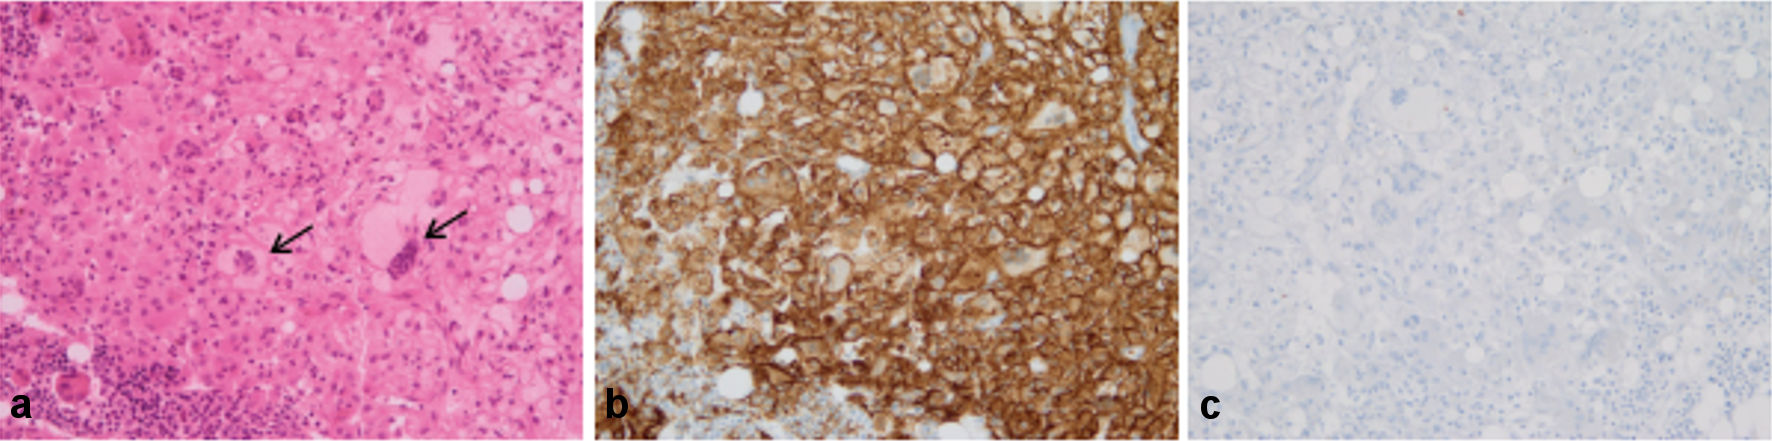
Figure 1. Bone marrow core biopsy. (a) Infiltration by large sheets of histiocytes, with abundant foamy or eosinophilic cytoplasm (H&E staining). A few Touton cells were also observed (arrows). (b) All histiocytes were intensely CD163+. (c) None of the cells were stained with anti-CD1a antibody (original magnification × 200).
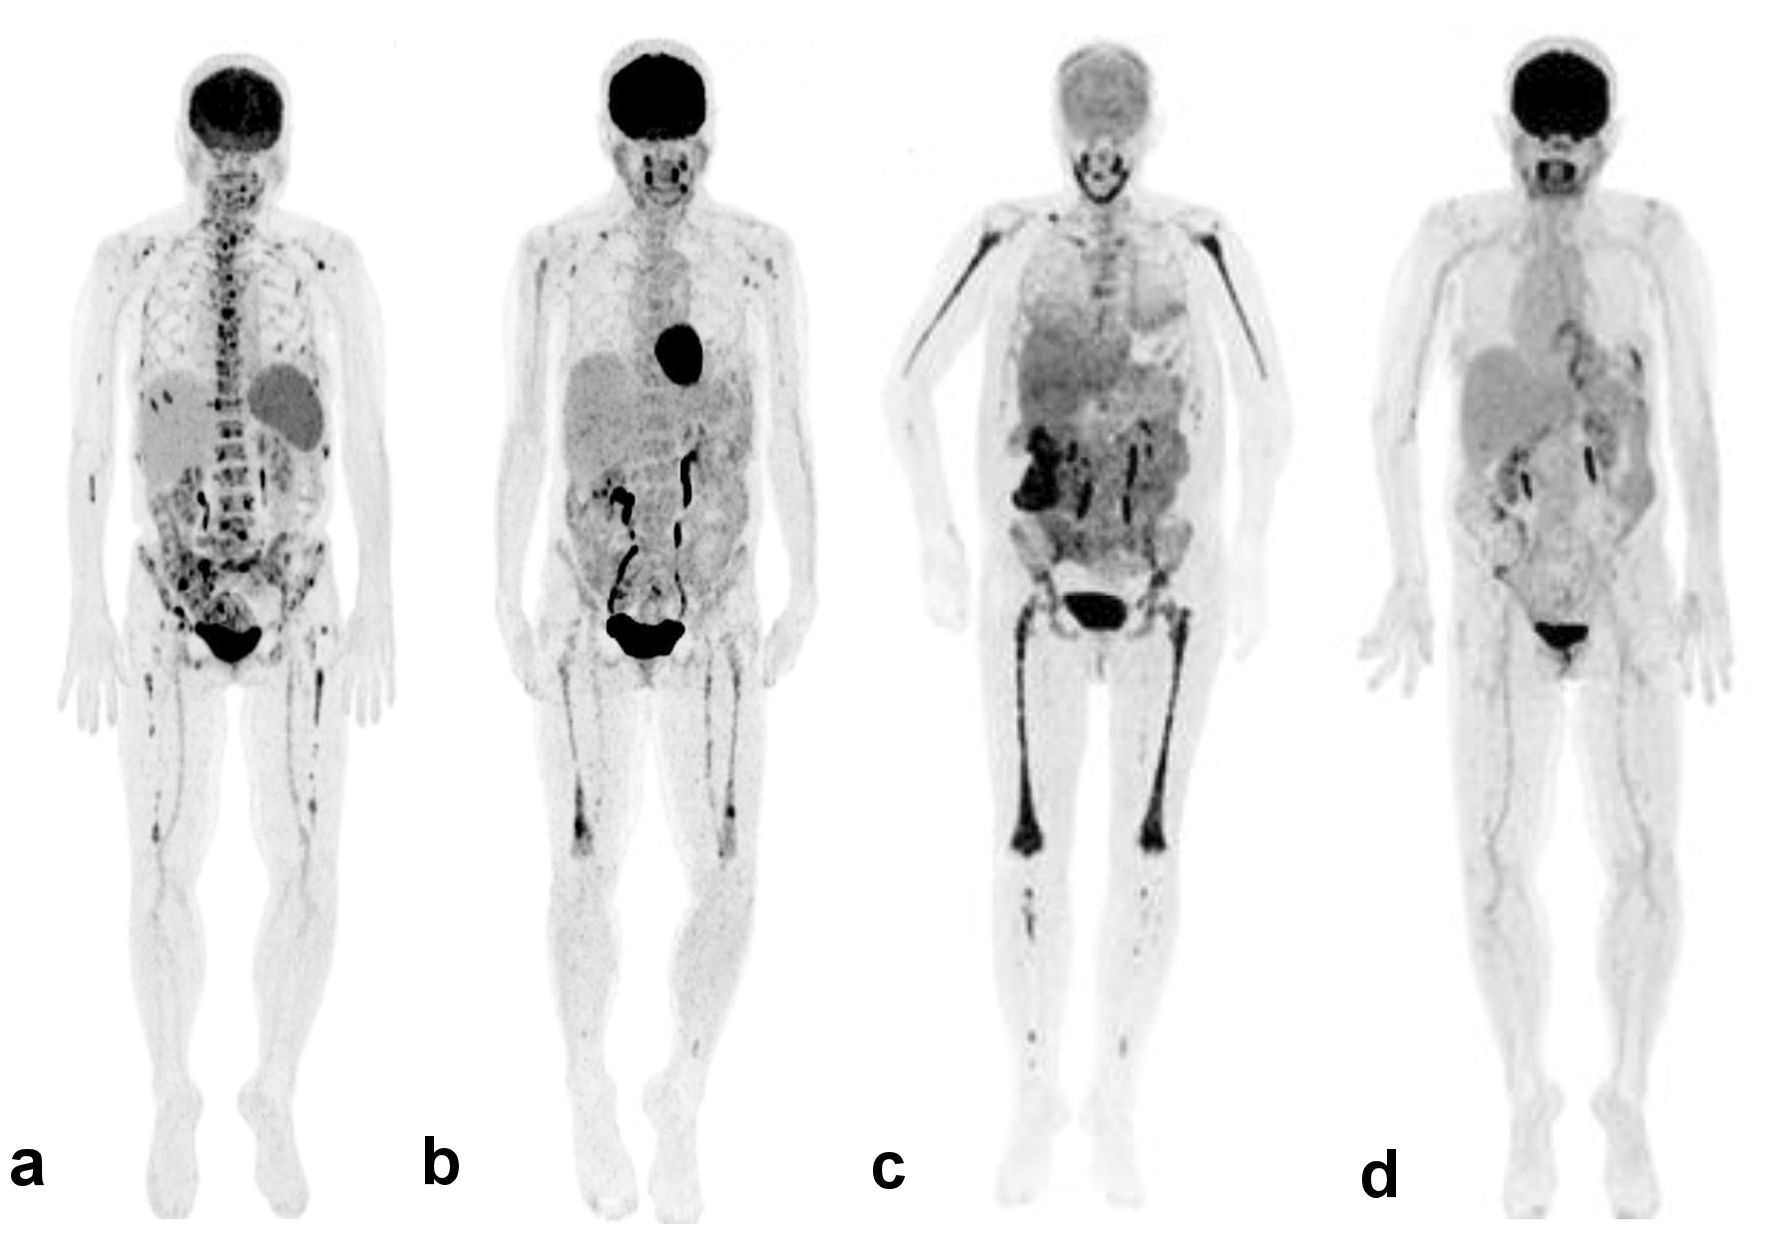
Figure 2. 18 F-FDG-PET-CT findings. Maximum intensity projection images of whole-body PET. (a) December 2017, at the time of initiation of trametinib. Diffuse bone marrow uptake, with focal hypermetabolic lesions in the axial and appendicular (especially in femurs) skeleton; diffuse homogeneous hypermetabolism in the spleen. (b) September 2018, under trametinib 1.5 mg/day. Decreased FDG uptake in the axial skeleton with extension of diffuse uptake in femurs, with a few focal lesions; decreased uptake in the spleen. (c) March 2019, at the time of initiation of cobimetinib. Diffuse intense hypermetabolism in the skeleton, with extension in peripheral bones; heterogeneous hypermetabolic uptake in the liver, intense hypermetabolism of the right colon and mild uptake of mesenteric infiltration; abundant non-hypermetabolic ascites. (d) November 2021, under cobimetinib 40 mg/day. Resolution of previous hypermetabolic lesions in the bone marrow, colon, and mesentery denoting a complete metabolic response. 18 F-FDG-PET-CT: 18 F-fluorodeoxyglucose positron emission tomography-computed tomography.
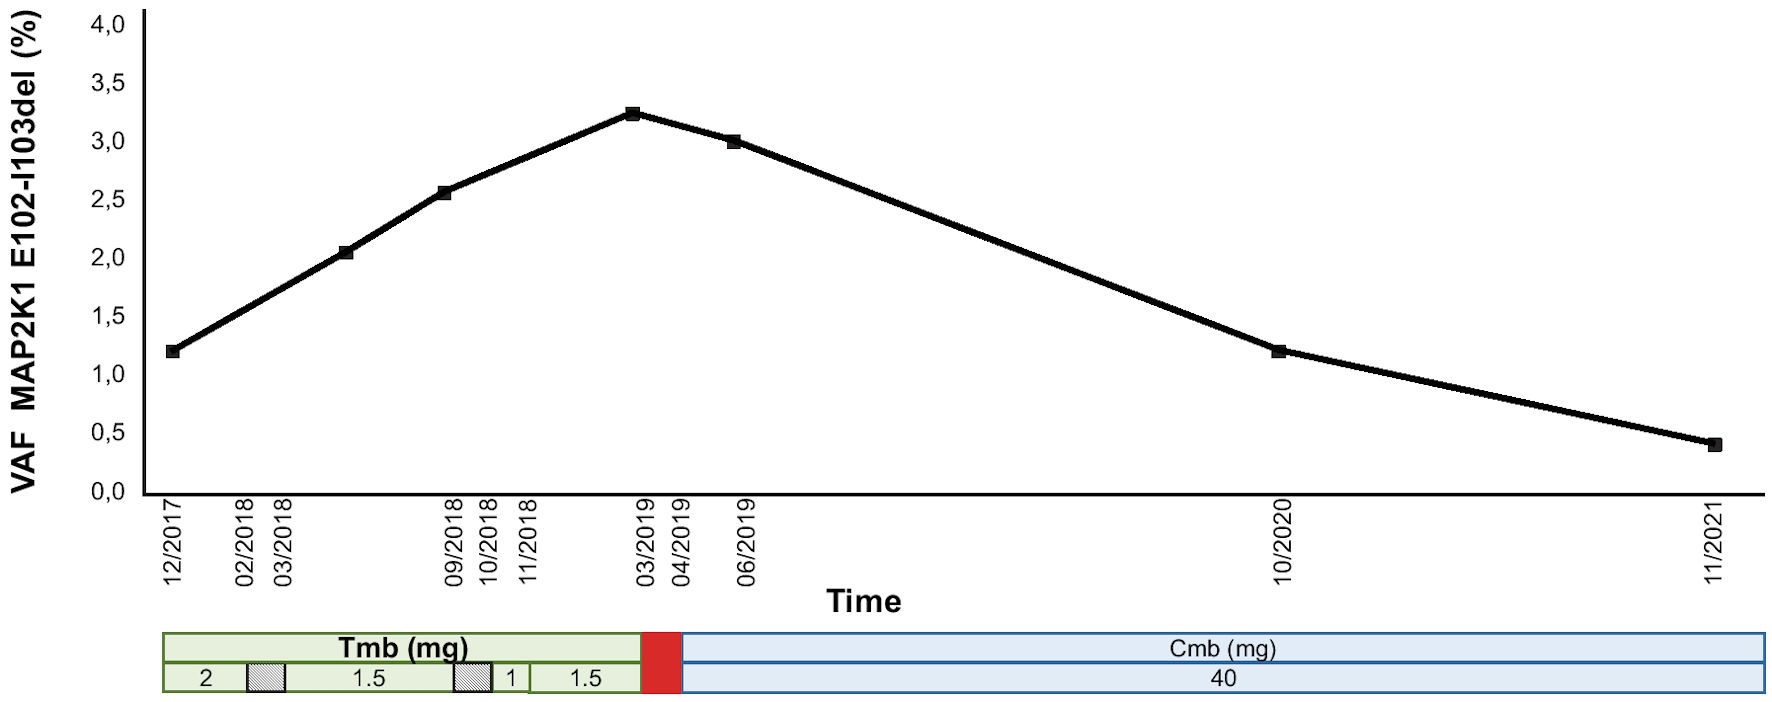
Figure 3. MAP2K1 E102-I103 deletion at the DNA level in the peripheral blood under MEK inhibitor treatment. The treatment regimen is shown at the bottom. Trametinib was transiently interrupted (diagonal stripes rectangle), each time because of LVEF decrease, and ultimately stopped (red rectangle) in the face of severe progression of the disease. The patient was then switched to cobimetinib. The data are expressed in terms of variant allelic frequency (VAF %). MEK inhibitor doses are in mg. VAF: variant allele frequency; Tmb: trametinib; Cmb: cobimetinib; LVEF: left ventricular ejection fraction.