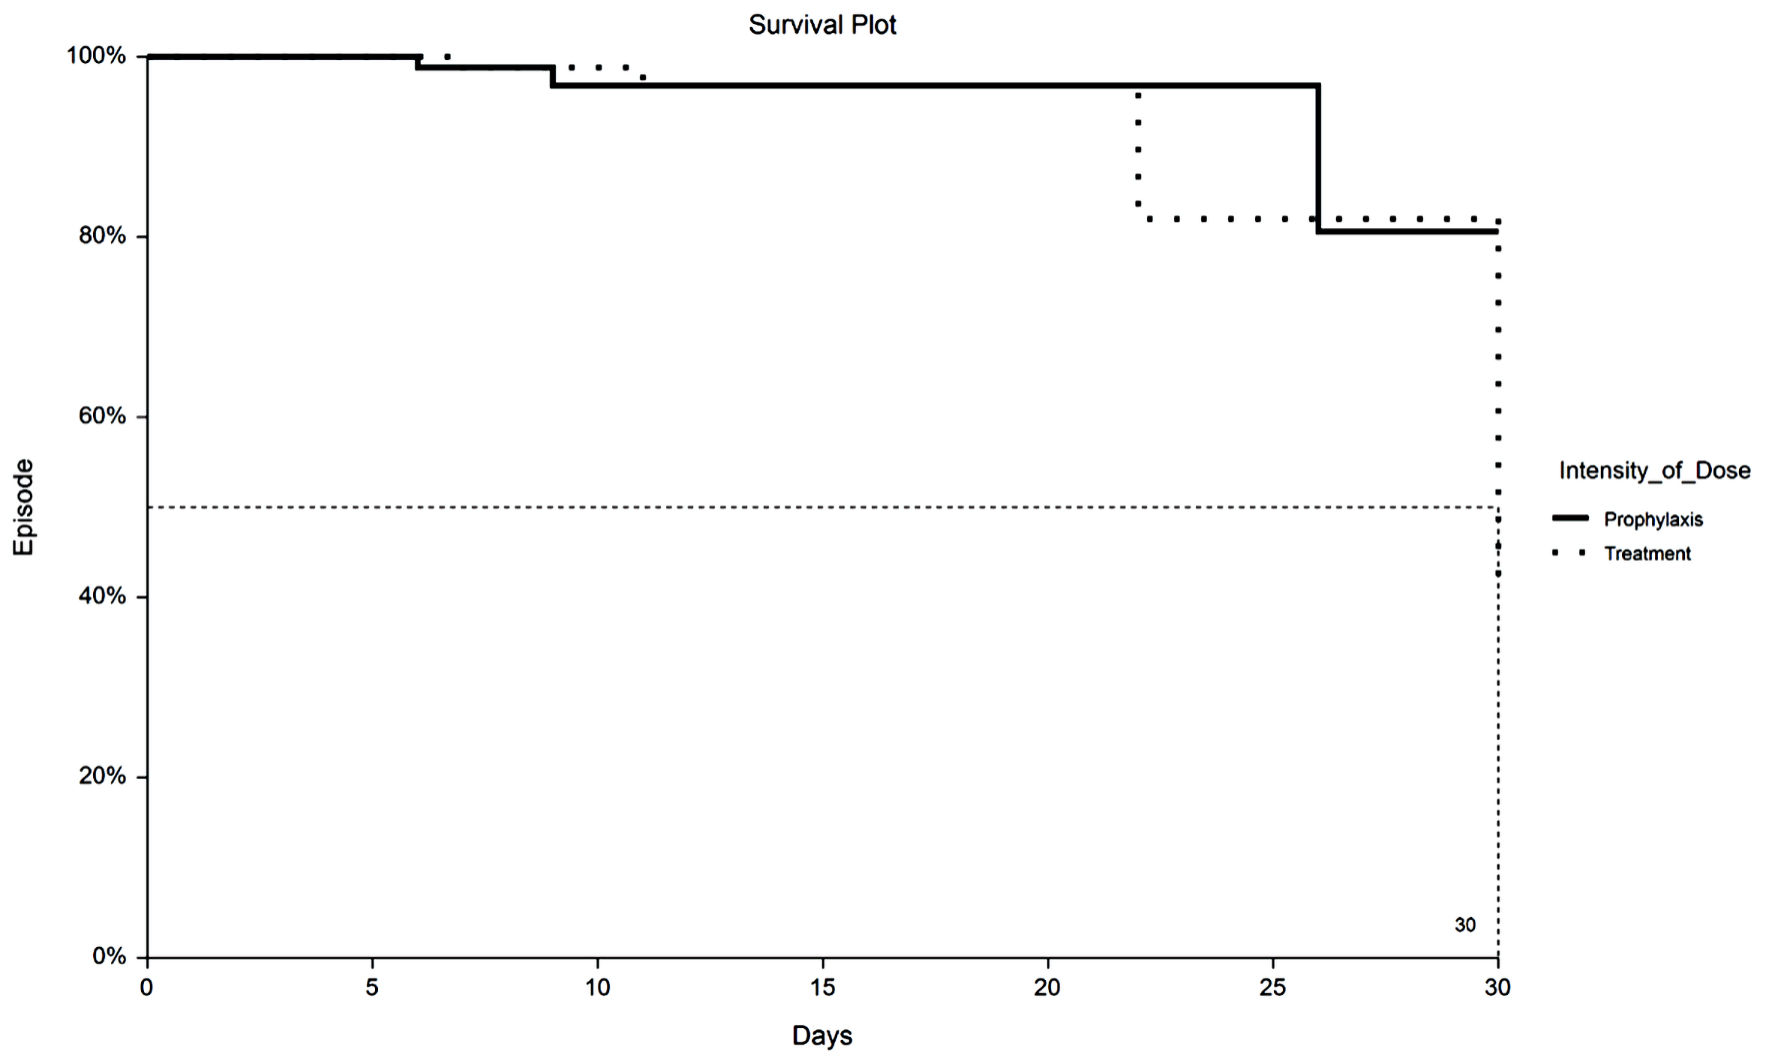
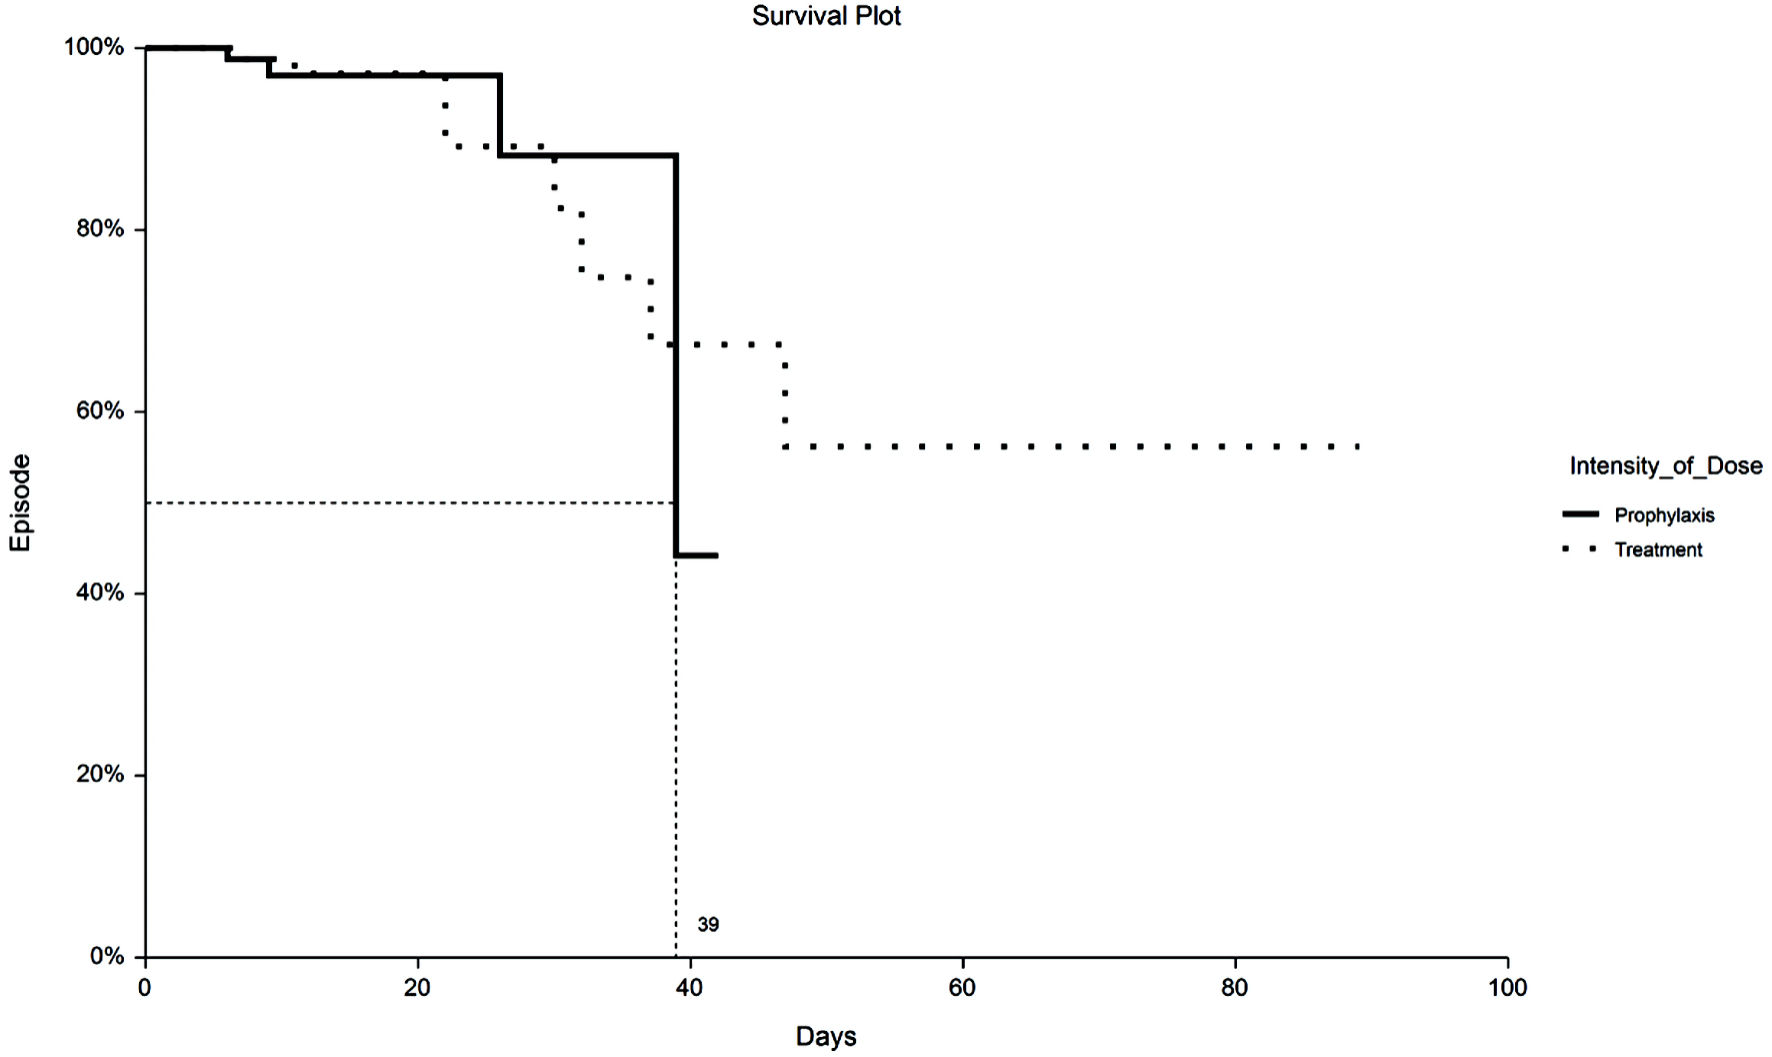
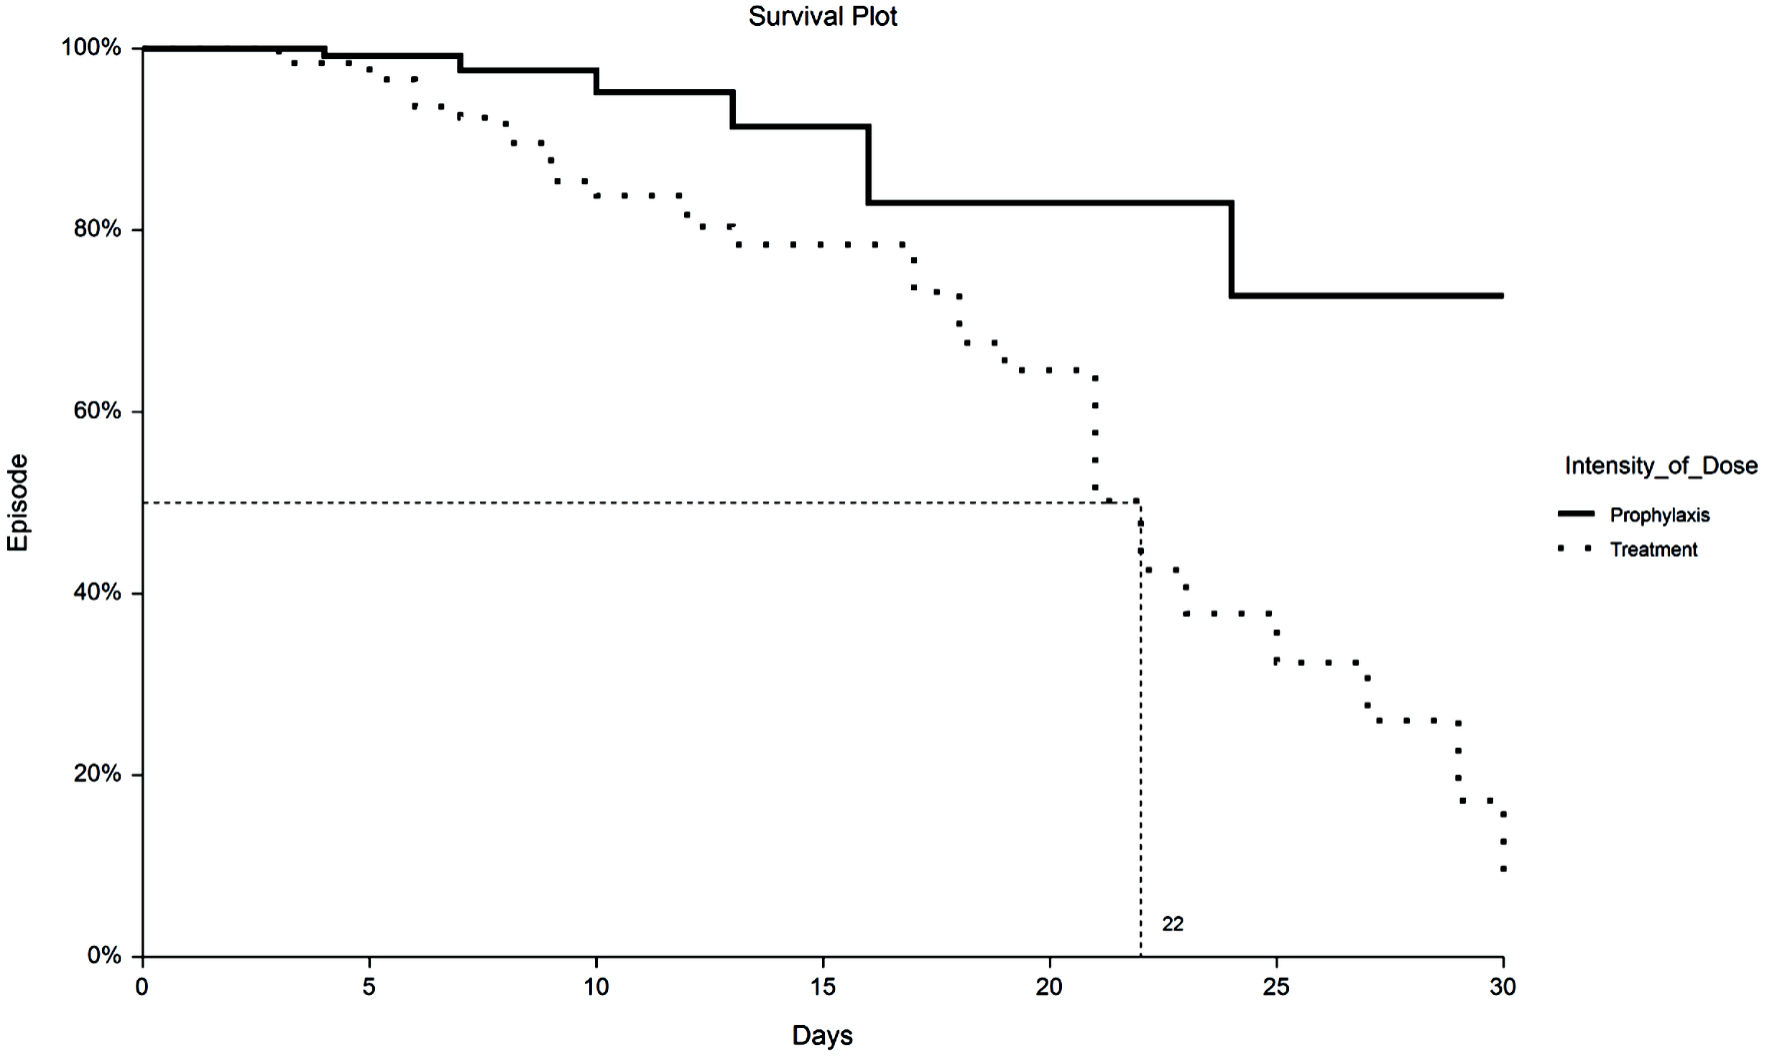
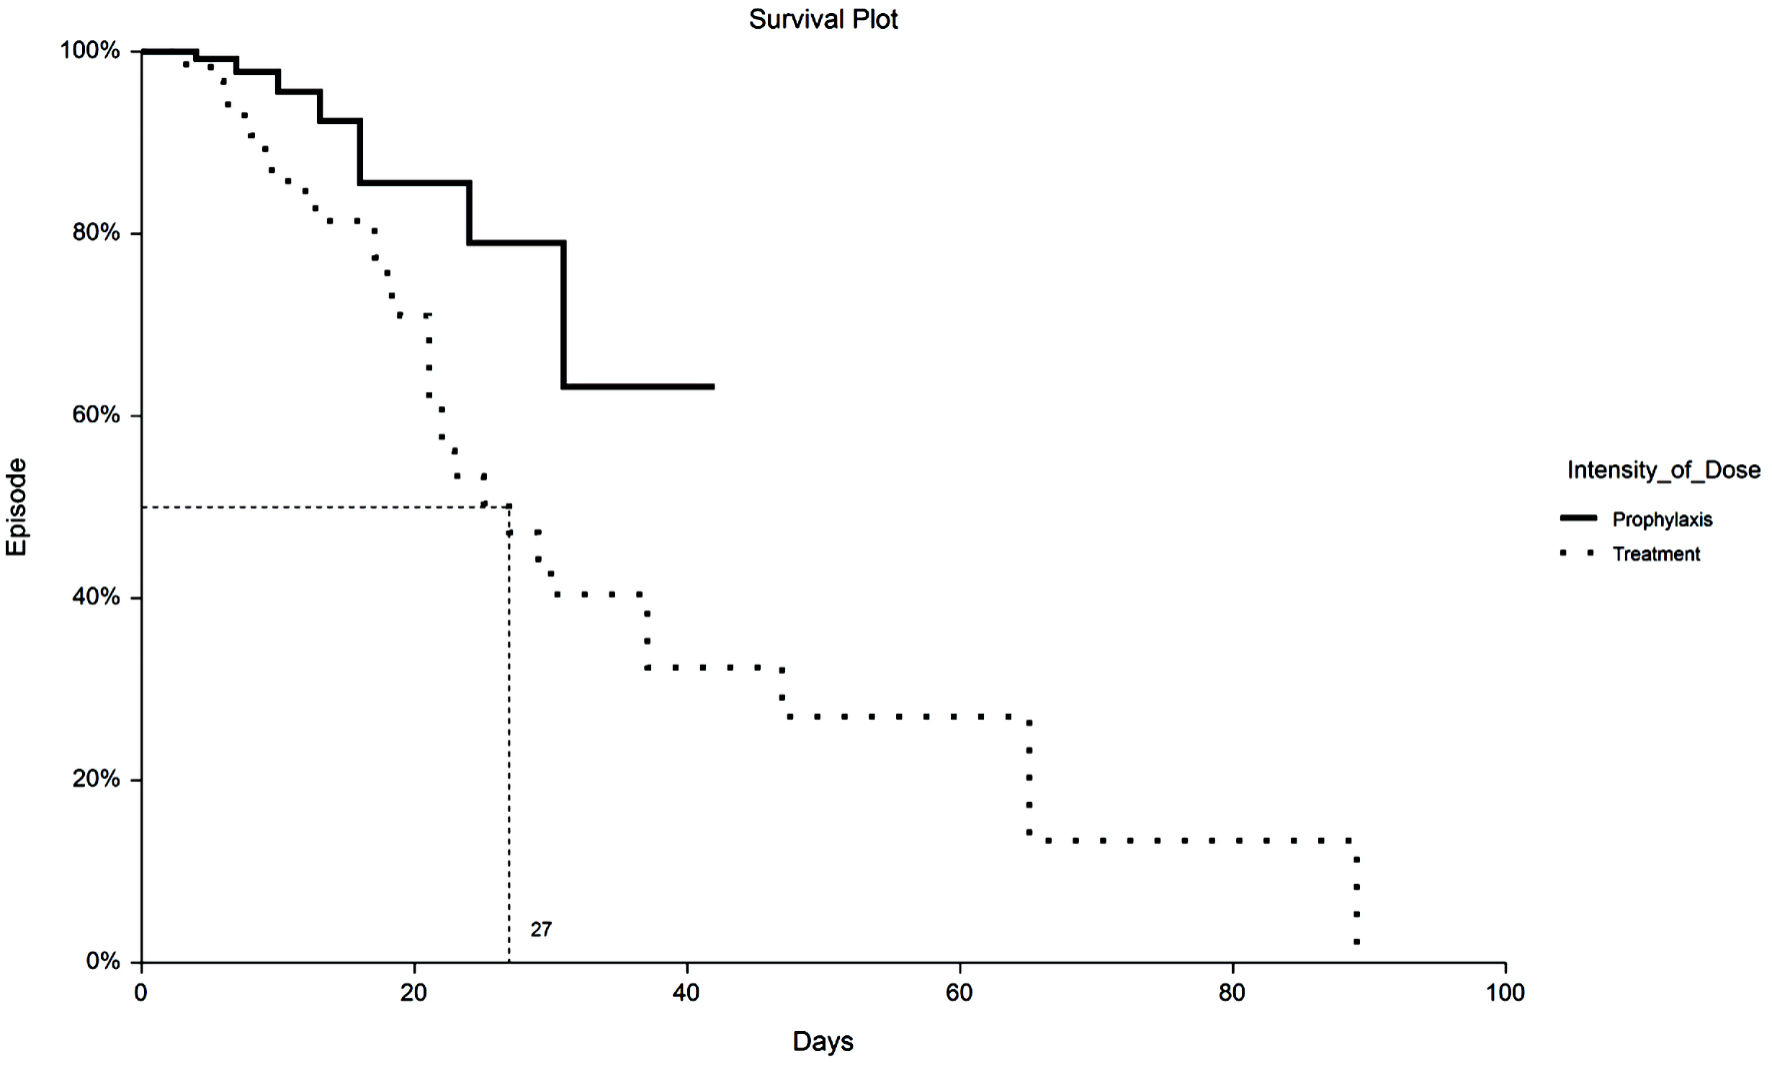
Figure 1. Kaplan-Meier plot of 30-day VTE by TX or PPX group. VTE: venous thromboembolism; PPX: prophylaxis-intensity; TX: therapeutic-intensity.
| Journal of Hematology, ISSN 1927-1212 print, 1927-1220 online, Open Access |
| Article copyright, the authors; Journal compilation copyright, J Hematol and Elmer Press Inc |
| Journal website https://www.thejh.org |
Original Article
Volume 11, Number 5, October 2022, pages 167-175
Incidence of Venous Thromboembolism in Hospitalized COVID-19 Patients Receiving Thromboprophylaxis
Figures
Tables
| Prophylactic anticoagulation (n = 141) | Therapeutic anticoagulation (n = 141) | |
|---|---|---|
| *P < 0.05, Wald’s test. **P < 0.05, KW ANOVA post-hoc Dunn’s test. IQR: interquartile range; BMI: body mass index; ACEI: angiotensin-converting enzyme inhibitor; ARB: angiotensin II receptor blocker; COPD: chronic obstructive pulmonary disease; HIV/AIDS: human immunodeficiency virus/acquired immunodeficiency syndrome; ICU: intensive care unit; tPA: tissue plasminogen activator; VTE: venous thromboembolism; ESRD: end-stage renal disease; CAD: coronary artery disease; PPI: proton pump inhibitor. | ||
| Demographic | ||
| Age (years), median (IQR) | 66 (54 - 80) | 66 (55 - 76) |
| Male, n (%) | 91 (67.4) | 99 (70.2) |
| BMI (kg/m2), median (IQR) | 28.8 (26 - 32.7) | 30.8 (25.8 - 33.7) |
| Race/ethnicity | ||
| Caucasian, n (%) | 87 (61.7) | 87 (61.7) |
| Hispanic, n (%) | 36 (24.8) | 25 (17.7) |
| African American, n (%) | 10 (7.1) | 14 (10.0) |
| Asian, n (%) | 1 (0.7) | 1 (0.7) |
| Other, n (%) | 8 (5.7) | 14 (9.9) |
| Comorbidities | ||
| Hypertension | 85 (60.3) | 87 (61.7) |
| Diabetes | 60 (42.6) | 62 (44.0) |
| Asthma | 12 (8.5) | 19 (13.5) |
| COPD | 10 (7.1) | 19 (13.5)* |
| Atrial fibrillation | 12 (8.5) | 10 (7.1) |
| Heart failure | 12 (8.5) | 9 (6.4) |
| History of VTE | 4 (2.8) | 4 (2.8) |
| CAD | 38 (27.0) | 36 (26) |
| Chronic kidney disease | 21 (14.9) | 10 (7.1)* |
| ESRD | 5 (3.6) | 0 (0)* |
| Liver disease | 2 (1.4) | 1 (0.7) |
| Cancer | 12 (8.5) | 11 (7.8) |
| HIV/AIDS | 2 (1.4) | 2 (1.4) |
| Smoking history | 4 (2.8) | 5 (3.6) |
| Charlson Comorbidity Index (median) | 3 (1 - 4) | 3 (1 - 4) |
| Hospital interventions | ||
| ICU | 13 (9.2) | 36 (25.5)* |
| Intubation/ventilator | 14 (9.9) | 40 (28.4)* |
| Steroids, n (%) | 112 (79.4) | 126 (89.4)* |
| tPA, n (%) | 3 (2.1) | 14 (9.9)* |
| Home medications | ||
| ACEI/ARBs, n (%) | 58 (41.3) | 66 (47.1) |
| Antiplatelet, n (%) | 48 (33.7) | 48 (34.0) |
| Anticoagulation, n (%) | 17 (12.1) | 13 (9.2) |
| Statins, n (%) | 63 (44.7) | 65 (46.1) |
| PPI, n (%) | 38 (27.0) | 49 (35.0) |
| Baseline vitals/labs | ||
| Systolic blood pressure (mm Hg), median (IQR) | 128 (118 - 146) | 131 (115 - 142) |
| Diastolic blood pressure (mm Hg), median (IQR) | 76 (67 - 85) | 79 (68 - 87) |
| Respiratory rate (breaths/min), median (IQR) | 18 (17 - 20) | 18 (18 - 20) |
| Oxygen saturation, median (IQR) | 96 (94 - 98) | 96 (94 - 98) |
| D-dimer (µg/mL), median (IQR) | 0.98 (0.61 - 1.82) | 1.47 (0.8 - 2.9) |
| D-dimer > 0.5 | 88% | 91% |
| Platelet count, median (IQR) | 199 (160 - 260) | 216 (158 - 291) |
| Prophylactic anticoagulation (n = 141) | Therapeutic anticoagulation (n = 141) | Odds ratio (95% CI) | P value | |
|---|---|---|---|---|
| *Statistically significant. CI: confidence interval; VTE: venous thromboembolism; LOS: length of stay; NA: not available. | ||||
| 30-day primary outcomes (n = 266) | ||||
| VTE, n (%) | 3 (2.2) | 5 (3.9) | 0.56 (0.2 - 2.0) | 0.5 |
| Mortality, n (%) | 7 (5.2) | 33 (25.4) | 0.16 (0.08 - 0.39) | < 0.0001* |
| Unrestricted primary outcomes | ||||
| VTE, n (%) | 6 (2.9) | 8 (5.7) | 2.02 (0.7 - 5.2) | 0.2 |
| Mortality, n (%) | 8 (3.8) | 38 (27.0) | 9.2 (4.0 - 17.7) | < 0.0001* |
| 30-day secondary outcomes (n = 266) | ||||
| Hemorrhagic events n (%) | 14 (10) | 21 (16) | 0.6 (0.3 - 1.22) | 0.2 |
| Hospital LOS, median days (IQR) | 6 (4 - 11) | 8 (5 - 15) | NA | 0.02* |
| Unrestricted secondary outcomes | ||||
| Hemorrhagic events n (%) | 15 (11) | 27 (19) | 0.5 (0.3 - 1.0) | 0.049* |
| Hospital LOS, median days (IQR) | 6 (3 - 9) | 9 (6 - 18) | NA | 0.003* |
| Group | Failed | Total | τ | RMST (τ)a | Standard error | Lower 95% CI | Upper 95% CI |
|---|---|---|---|---|---|---|---|
| aEstimates are based on an interval upper limit of τ = 42.0, the smallest maximum observed time among all groups. CI: confidence interval; PPX: prophylaxis-intensity; TX: therapeutic-intensity. | |||||||
| PPX | 8 | 141 | 42.0 | 34.9 | 2.370 | 30.2 | 39.5 |
| TX | 38 | 141 | 42.0 | 27.4 | 1.712 | 24.0 | 30.7 |
| Independent variable | Risk ratio | P |
|---|---|---|
| aMeans the P value is referring to patients in the ICU (1) vs. patients not in the ICU (0), likewise for ventilator status. *Statistically significant. COPD: chronic obstructive pulmonary disease; ICU: intensive care unit; PPX: prophylaxis-intensity; TX: therapeutic-intensity. | ||
| ICU (1 - 0) | 2.1 (1.4 - 3.1) | 0.0002* |
| COPD (1 - 0) | 1.75 (1.1 - 2.7) | 0.01* |
| Age (≥ 65 - < 65) | 1.56 (1.1 - 2.3) | 0.02* |
| TX group (TX - PPX) | 1.34 (0.9 - 2.0) | 0.16 |
| Ventilator | 1.1 (0.7 - 1.7) | 0.7 |
| ICU (1 - 0)a ventilator (1 - 0)a | 0.46 (0.31 - 0.69) | 0.0002* |