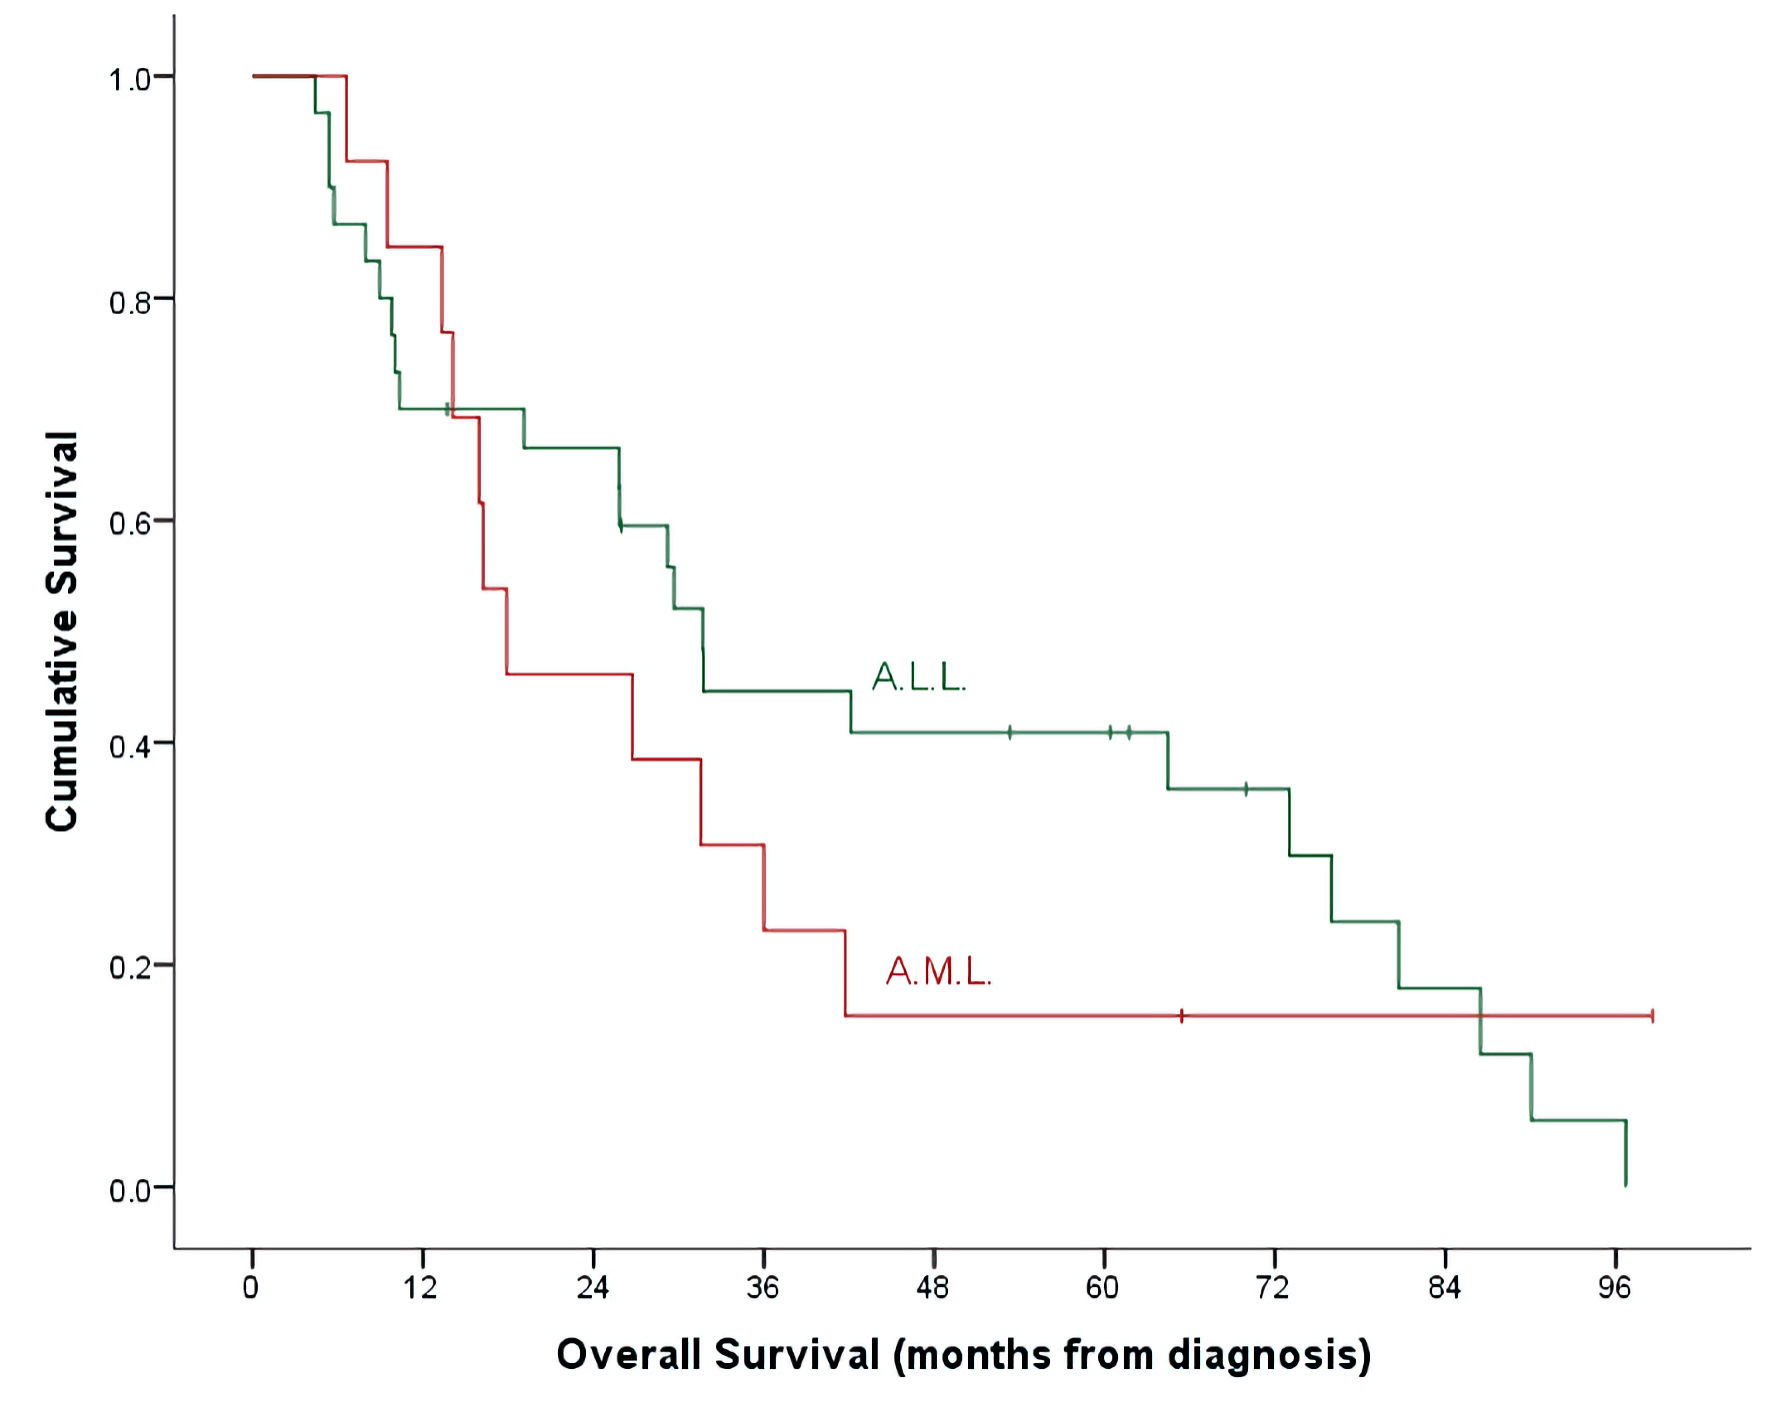
Figure 1. OS by leukemia subtypes. ALL: acute lymphoblastic leukemia; AML: acute myeloid leukemia; OS: overall survival.
| Journal of Hematology, ISSN 1927-1212 print, 1927-1220 online, Open Access |
| Article copyright, the authors; Journal compilation copyright, J Hematol and Elmer Press Inc |
| Journal website https://www.thejh.org |
Original Article
Volume 12, Number 1, February 2023, pages 16-26
Clofarabine in Pediatric Acute Relapsed or Refractory Leukemia: Where Do We Stand on the Bridge to Hematopoietic Stem Cell Transplantation?
Figures
Tables
| ALL (30, 69.8%) | AML (13, 30.2%) | Total | P value | |
|---|---|---|---|---|
| Values are presented as median (range) for continuous and numbers (percentage) for discrete data. ALL: acute lymphoblastic leukemia; AML: acute myeloid leukemia; BM: bone marrow; WBC: white blood cell; Hb: hemoglobin. | ||||
| Median age at diagnosis, years, (range) | 5.1 (0.4 - 13.0) | 6.0 (1.1 - 11.7) | 5.4 (0.4 - 13.0) | 0.979 |
| Gender n (%) | 0.460 | |||
| Female | 7 (23.3%) | 5 (38.5%) | 12 (27.9%) | |
| Male | 23 (76.7%) | 8 (61.5%) | 31 (72.1%) | |
| Leukemia subtypes, n (%) | ||||
| B-cell | 25 (83.3%) | - | ||
| T-cell | 4 (13.3%) | - | ||
| Biphenotypic | 1 (3.3%) | - | ||
| M0 | - | None | ||
| M1 | - | None | ||
| M2 | - | None | ||
| M3 | - | None | ||
| M4 | - | None | ||
| M5 | - | 1 (7.7%) | ||
| M6 | - | None | ||
| M7 | - | 2 (15.4%) | ||
| Unknown | - | 10 (76.9%) | ||
| Cytogenetics | ||||
| Favorable | 14 (46.7%) | - | ||
| Unfavorable | 13 (43.3%) | - | ||
| Unknown | 3 (10.0%) | - | ||
| Low risk | - | 1 (7.7%) | ||
| Intermediate risk | - | 2 (15.4%) | ||
| High risk | - | 10 (76.9%) | ||
| Risk group | < 0.001 | |||
| Low | None | 1 (7.7%) | 1 (2.3%) | |
| Intermediate | None | 2 (15.4%) | 2 (4.7%) | |
| Standard | 15 (50.0%) | None | 15 (34.9%) | |
| High | 15 (50.0%) | 9 (69.2%) | 24 (55.8%) | |
| Very high | None | 1 (7.7%) | 1 (2.3%) | |
| CNS disease | 0.841 | |||
| CNS-1 | 22 (73.3%) | 11 (84.6%) | 33 (76.7%) | |
| CNS-2 | 6 (20.0%) | 1 (7.7%) | 7 (16.3%) | |
| CNS-3 | 2 (6.7%) | 1 (7.7%) | 3 (7.0%) | |
| Hematological profile, median (range) | ||||
| Pre-treatment WBC | 32.6 (1.5 - 440.0) | 11.6 (0.9 - 226.0) | - | |
| Post-treatment WBC | 2.6 (0.1 - 20.8) | 4.9 (0.1 - 6.6) | - | |
| Pre-treatment platelets | 44.0 (0.6 - 279.0) | 66.0 (0.7 - 252.0) | - | |
| Post-treatment platelets | 38.5 (6.0 - 482.0) | 27.0 (6.0 - 220.0) | - | |
| Pre-treatment Hb | 86.5 (49.0 - 123.0) | 93.0 (70.0 - 120.0) | - | |
| Post-treatment Hb | 87.0 (69.0 - 124.0) | 85.0 (74.0 - 109.0) | - | |
| Clofarabine indications | 0.503 | |||
| Refractory disease | 14 (46.7%) | 4 (30.8%) | 18 (41.9%) | |
| Relapse | 16 (53.3%) | 9 (69.2%) | 25 (58.1%) | |
| BM | 8 (50.0%) | 8 (88.9%) | ||
| CNS | 1 (6.2%) | 1 (11.1%) | ||
| Extramedullary | 1 (6.2%) | None | ||
| BM + CNS | 5 (31.2%) | None | ||
| BM + testicular | 1 (6.2%) | None | ||
| Relapse I | 5 (31.2%) | 3 (33.3%) | 8 (32.0%) | |
| Relapse II | 11 (68.8%) | 6 (66.7%) | 17 (68.0%) | |
| Median time to cycle 1 of clofarabine months, (range) | 15.8 (1.1 - 77.8) | 11.2 (1.1 - 36.0) | 13.4 (1.1 - 77.8) | 0.428 |
| Minimum residual disease (+) | ||||
| Day 14 | 10 of 25 (40.0%) | - | ||
| Day 28 | 15 of 30 (50.0%) | - | ||
| Post-consolidation | 5 of 11 (45.5%) | - | ||
| Post-induction I | - | 11 of 12 (91.7%) | ||
| Post-induction II | - | 5 of 10 (50.0%) | ||
| Post-intensification I | - | 3 of 7 (42.9%) | ||
| Number of clofarabine cycles (per case) | 1.000 | |||
| One cycle | 19 (63.3%) | 8 (61.5%) | 27 (62.8%) | |
| Two cycles | 11 (36.7%) | 5 (38.5%) | 16 (37.2%) | |
| ALL (30, 69.8%) | AML (13, 30.2%) | Total | P value | |
|---|---|---|---|---|
| Values are presented as median (range) for continuous and numbers (percentage) for discrete data. aBone marrow was not done for three cases post cycle 1. bMantel-Haenszel. ALL: acute lymphoblastic leukemia; AML: acute myeloid leukemia; HSCT: hematopoietic stem cell transplantation; BM: bone marrow; WBC: white blood cell; CR: complete response; HCT: hematopoietic cell transplantation. | ||||
| Post-clofarabine bone marrow responsea | 0.498 | |||
| Positive | 17 (58.6%) | 5 (45.5%) | 22 (55.0%) | |
| Negative | 12 (41.4%) | 6 (54.5%) | ||
| After cycle 1 (negative BM) | 13 of 29 (44.8%) | 6 of 11 (54.5%) | 19 of 40 (47.5%) | |
| After cycle 2 (negative BM) | 5 of 11 (45.4%) | 4 of 5 (80.0%) | 9 of 16 (56.3%) | |
| Overall response to clofarabine treatment | 0.747 | |||
| Failure | 18 (60.0%) | 7 (53.8%) | 25 (58.1%) | |
| CR | 12 (40.0%) | 6 (46.2%) | 18 (41.9%) | |
| Hematopoietic recovery | 13 (68.4%) | 6 (31.6%) | 19 (44.2%) | 1.000 |
| Incomplete | 7 (53.8%) | 3 (50.0%) | 10 (52.6%) | |
| Complete | 6 (46.2%) | 3 (50.0%) | 9 (47.4%) | |
| Treatment (clofarabine) failure by | ||||
| Treatment cycles | 0.262b | |||
| One cycle only | 12 (63.2%) | 6 (75.0%) | 18 (66.7%) | |
| Two cycles | 6 (54.5%) | 1 (20.0%) | 7 (43.8%) | |
| Pre-treatment disease status | 0.557b | |||
| Relapse | 10 (62.5%) | 3 (33.3%) | 13 (52.0%) | |
| Refractory disease | 8 (57.1%) | 4 (100.0%) | 12 (66.7%) | |
| Initial risk assignment | 0.060/1.000 | |||
| Low | - | 1 (100.0%) | 1 (100.0%) | |
| Intermediate | - | 1 (50.0%) | 1 (50.0%) | |
| Standard | 6 (40.0%) | - | 6 (40.0%) | |
| High | 12 (80.0%) | 4 (44.4%) | 16 (66.7%) | |
| Very high | - | 1 (100.0%) | 1 (100.0%) | |
| Cytology (n = 23) | 0.440/1.000 | |||
| Favorable | 7 (50.0%) | 7 (50.0%) | ||
| Unfavorable | 9 (69.2%) | 9 (69.2%) | ||
| Low risk | - | 1 (100.0%) | 1 (100.0%) | |
| Intermediate risk | - | 1 (50.0%) | 1 (50.0%) | |
| High risk | - | 5 (50.0%) | 5 (50.0%) | |
| CNS disease | 0.565/0.192 | |||
| CNS-1 | 12 (54.5%) | 7 (63.6%) | 19 (57.6%) | |
| CNS-2 | 4 (66.7%) | None | 4 (57.1%) | |
| CNS-3 | 2 (100.0%) | None | 2 (66.7%) | |
| Site of relapse prior to clofarabine | 0.502/0.333 | |||
| BM | 6 (75.0%) | 2 (25.0%) | 8 (50.0%) | |
| CNS | None | 1 (100.0%) | 1 (50.0%) | |
| Extramedullary | 1 (100.0%) | None | 1 (100.0%) | |
| BM + CNS | 2 (40.0%) | None | 2 (40.0%) | |
| BM + testicular | 1 (100.0%) | None | 1 (100.0%) | |
| Risk assignment before relapse | 0.500/NA | |||
| High | 8 (57.1%) | 3 (33.3%) | 11 (47.8%) | |
| Very high | 2 (100.0%) | None | 2 (100.0%) | |
| Number of relapses | 1.000/1.000 | |||
| Relapse I | 3 (60.0%) | 1 (33.3%) | 4 (50.0%) | |
| Relapse II | 7 (63.6%) | 2 (33.3%) | 9 (52.9%) | |
| Stem cell transplantation | 0.332 | |||
| Negative | 19 (63.3%) | 6 (46.2%) | 25 (58.1%) | |
| Positive | 11 (36.7%) | 7 (53.8%) | 18 (41.9%) | |
| Post-clofarabine CR | 1.000 | |||
| HSCT (-) | 2 (16.7%) | None | 2 (11.1%) | |
| HSCT (+) | 10 (83.3%) | 6 (100.0%) | 16 (88.9%) | |
| Post-clofarabine treatment failure | 0.529 | |||
| HSCT (-) | 17 (73.9%) | 6 (85.7%) | 23 (92.0%) | |
| HSCT (+) | 1 (5.6%) | 1 (14.3%) | 2 (8.0%) | |
| Median time to HCT from cycle 1, months, (range) | 2.7 (1.2 - 6.4) | 2.6 (1.4 - 5.3) | 2.7 (1.2 - 6.4) | 0.930 |
| Survival status | 1.000 | |||
| Alive | 6 (20.0%) | 2 (15.4%) | 8 (18.6%) | |
| Expired | 24 (80.0%) | 11 (84.6%) | 35 (81.4%) | |
| Post-clofarabine CR | 0.363 | |||
| Alive | 5 (41.7%) | 1 (16.7%) | 6 (33.3%) | |
| Expired | 7 (58.3%) | 5 (83.3%) | 12 (66.7%) | |
| Post-clofarabine treatment failure | 0.490 | |||
| Alive | 1 (5.6%) | 1 (14.3%) | 2 (8.0%) | |
| Expired | 17 (94.4%) | 6 (85.7%) | 23 (92.0%) | |
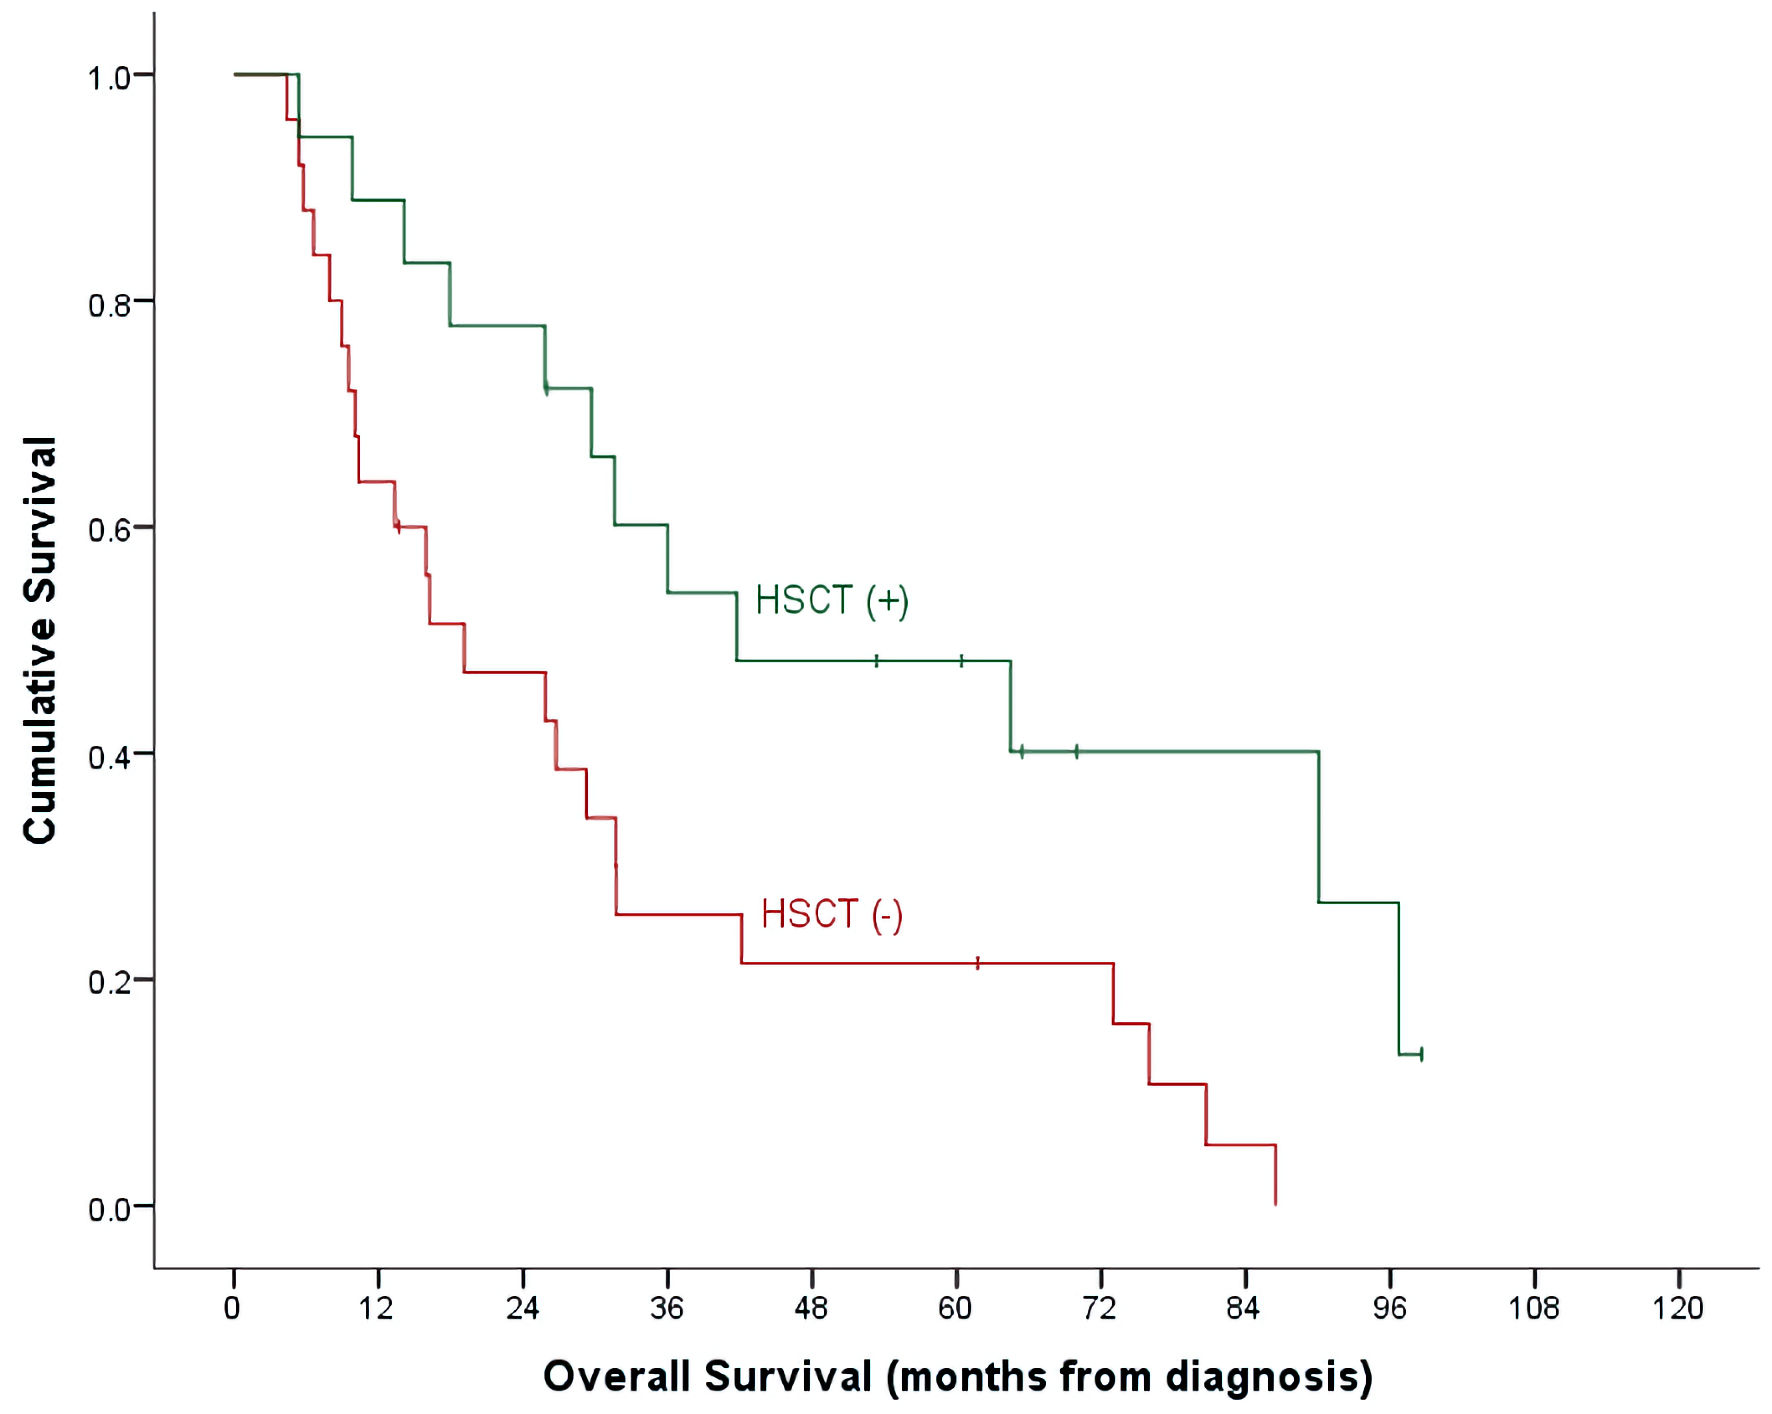
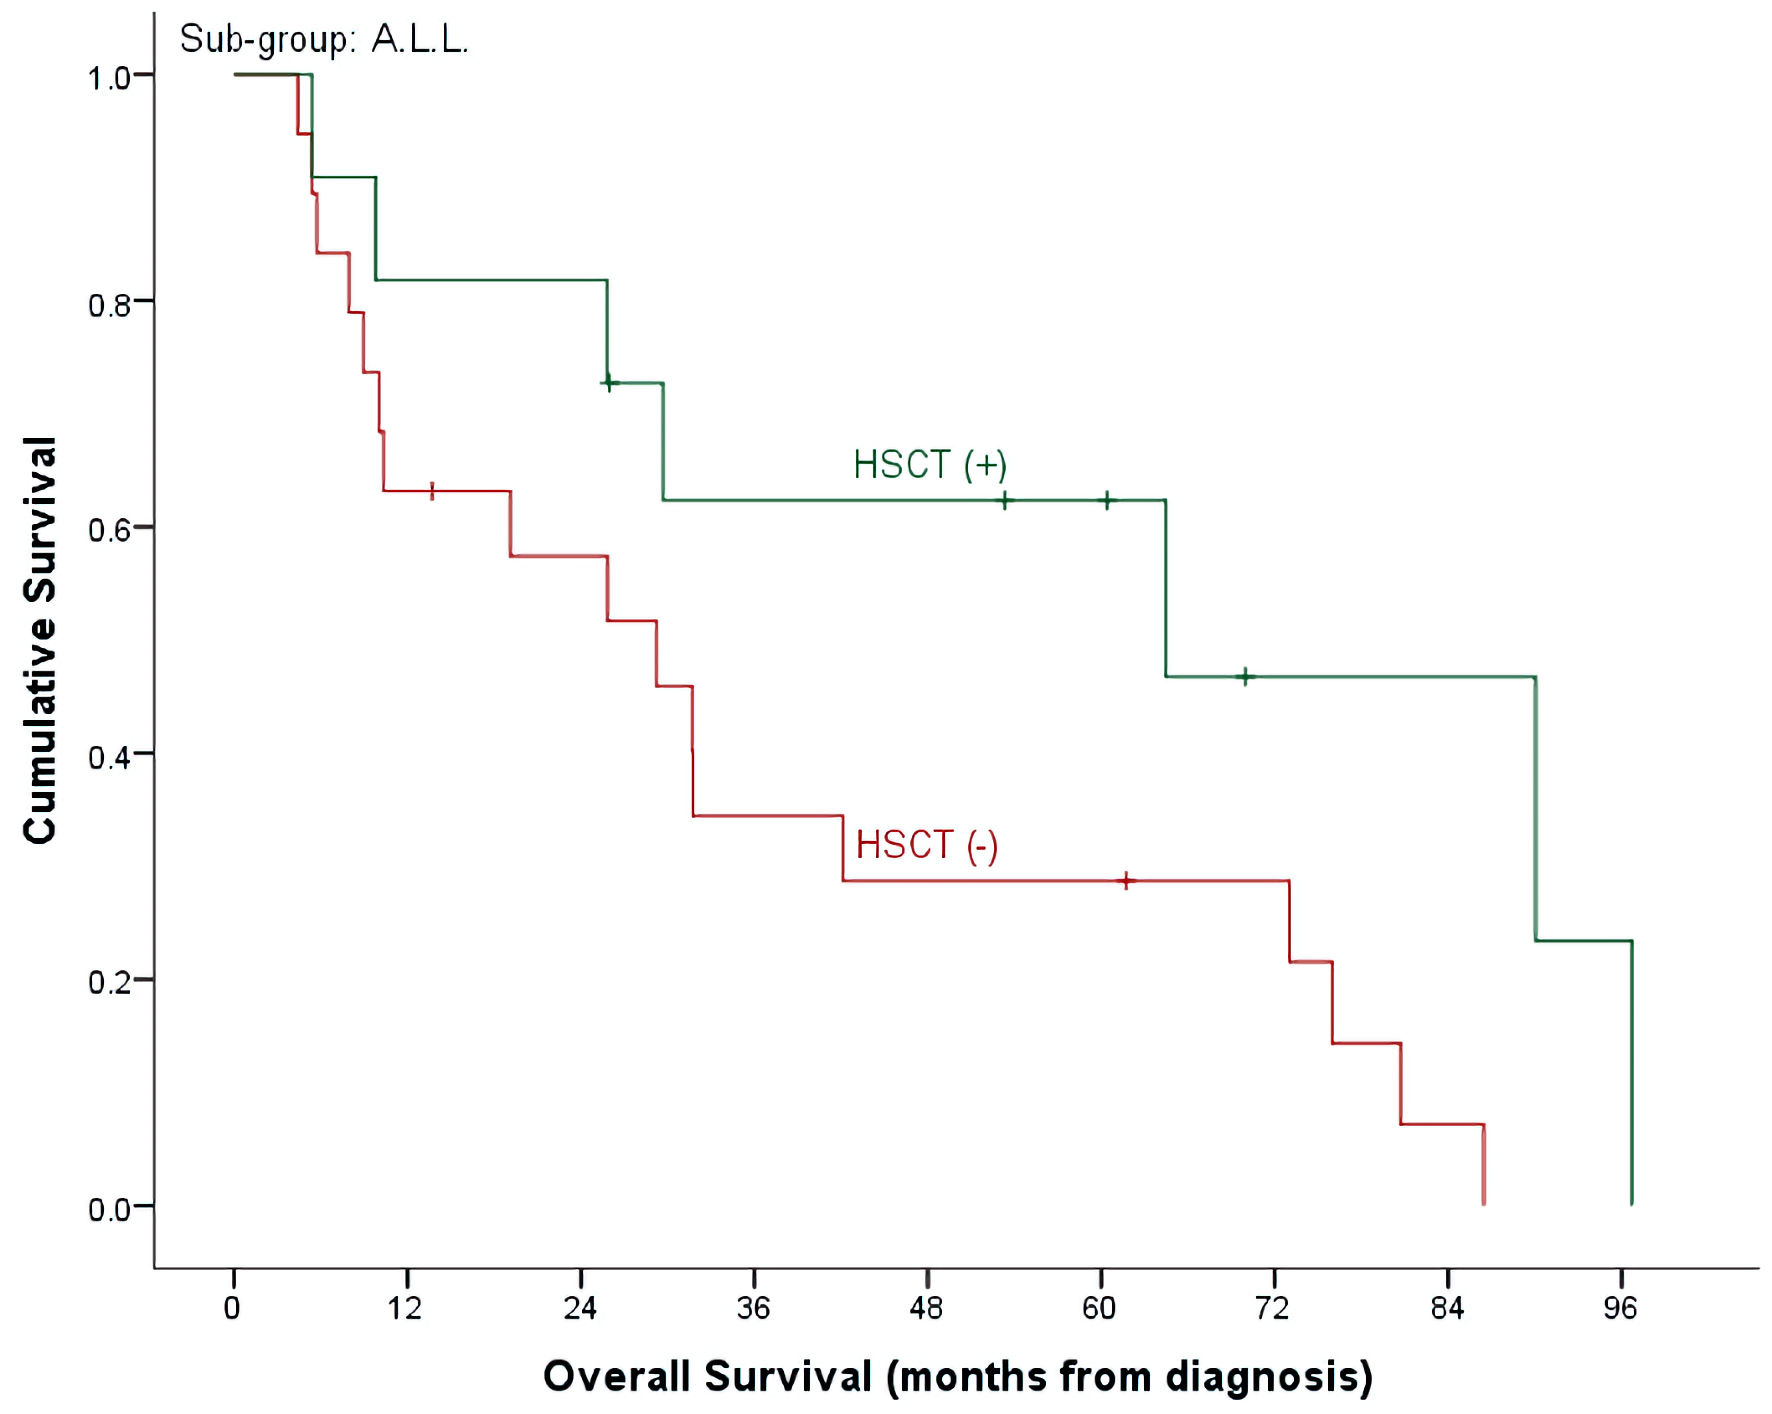
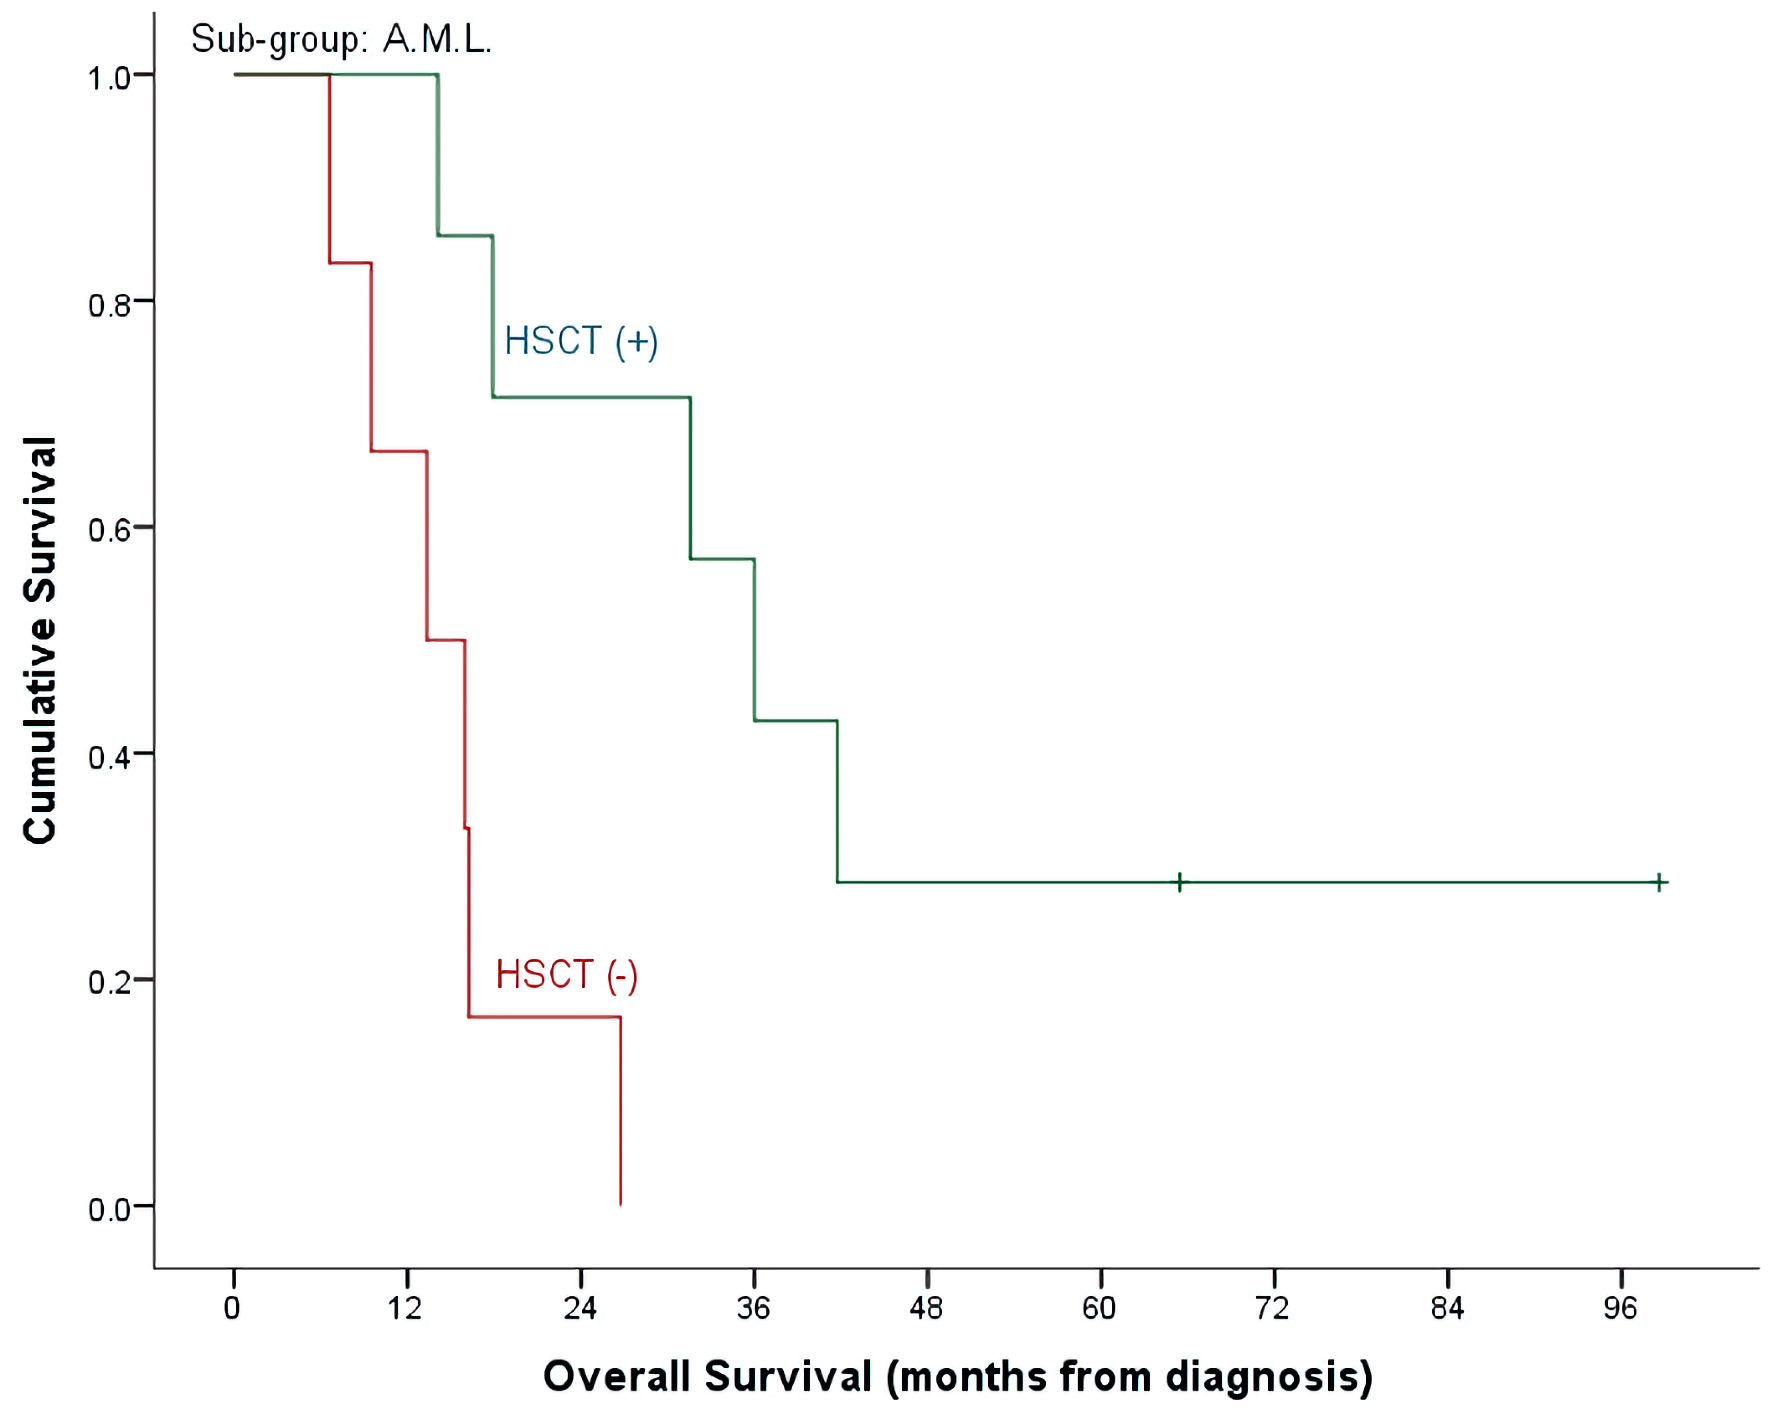
| Overall survival (5 year) | 40.9±9.3% | 15.4±10.0% | 32.7±7.3% | 0.492 |
| HSCT (-), n = 25, events = 23 | 28.7±10.7% | 0.0±0.0% | 21.4±8.4% | |
| HSCT (+), n = 18, events = 12 | 62.3±15.0% | 28.6±17.1% | 48.1±12.1% | |
| (P = 0.140) | (P = 0.009) | (P = 0.024) | ||
| ALL (30, 69.8%) | AML (13, 30.2%) | Total (43, 100%) | |
|---|---|---|---|
| Values are presented as numbers (percentage). Grading is as per CTCAE 5.0. Resolution of hepatic toxicity was seen in 20 cases while three patients succumbed to their disease. ALL: acute lymphoblastic leukemia; AML: acute myeloid leukemia; CTCAE: Common Terminology Criteria for Adverse Events; ICU: intensive care unit; NOS: not otherwise specified. | |||
| Observed toxicity | 26 (86.7%) | 13 (100.0%) | 39 (90.7%) |
| Mucosal infection | 7 (23.3%) | 5 (38.5%) | 12 (27.9%) |
| Grade 1 | - | - | - |
| Grade 2 | - | 1 (7.7%) | 1 (2.3%) |
| Grade 3 | 5 (16.7%) | - | 5 (11.6%) |
| Grade 4 | 2 (6.7%) | 4 (30.8%) | 6 (14.0%) |
| Hepatobiliary disorders | 16 (53.3%) | 7 (53.8%) | 23 (53.5%) |
| Hepatic failure | 3 (10.0%) | - | 3 (7.0%) |
| Sinusoidal obstruction syndrome (grade 2) | 1 (3.3%) | - | 1 (2.3%) |
| Hyperbilirubinemia | 5 (16.7%) | 2 (15.4%) | 7 (16.3%) |
| Grade 1 | 1 (3.3%) | 1 (7.7%) | 2 (4.7%) |
| Grade 2 | - | 1 (7.7%) | 1 (2.3%) |
| Grade 3 | 4 (13.3%) | - | 4 (9.3%) |
| Grade 4 | - | - | - |
| Transaminitis | 16 (53.3%) | 7 (53.8%) | 23 (53.5%) |
| Grade 1 | 2 (6.7%) | 1 (7.7%) | 3 (7.0%) |
| Grade 2 | 4 (13.3%) | - | 4 (9.3%) |
| Grade 3 | 6 (20.0%) | 6 (46.2%) | 12 (27.9%) |
| Grade 4 | 4 (13.3%) | - | 4 (9.3%) |
| Febrile neutropenia | 24 (80.0%) | 12 (92.3%) | 36 (83.7%) |
| Encephalopathy (grade 2) | - | 1 (100%) | 1 (2.3%) |
| Renal and urinary disorders | |||
| Acute kidney injury (grade 2) | - | 2 (15.4%) | 2 (4.7%) |
| Infections and infestations | |||
| Bacterial infections | 17 (56.7%) | 8 (61.5%) | 25 (58.1%) |
| Viral infections | 5 (16.7%) | 1 (7.7%) | 6 (14.0%) |
| Fungal infections | 8 (26.7%) | 4 (30.8%) | 12 (27.9%) |
| Sepsis (NOS) | 9 (30.0%) | 4 (30.8%) | 13 (30.2%) |
| ICU admissions | 13 (43.3%) | 6 (46.2%) | 19 (44.2%) |
| ALL (30, 69.8%) | AML (13, 30.2%) | Total (43,100%) | |
|---|---|---|---|
| Values are presented as numbers (percentage). TBI: total body irradiation; Flu: fludarabine; Bu: Busulfan; Cy: cyclophosphamide; MTX: methotrexate; ATG: antithymocyte globulin; CSA: cyclosporine; MMF: mycophenolate mofetil; ALL: acute lymphoblastic leukemia; AML: acute myeloid leukemia; GVHD: graft-versus-host disease; ANC: absolute neutrophil count. | |||
| Transplanted | 11 (36.7%) | 7 (53.8%) | 18 (41.9%) |
| Time to transplant from clofarabine cycle 1 | 2.7 (1.2 - 6.4) | 2.6 (1.4 - 5.3) | 2.7 (1.2 - 6.4) |
| Donor type | |||
| Matched related | 9 (81.9%) | 6 (85.7%) | 15 (83.3%) |
| Haploidentical | 2 (18.2%) | 1 (14.3%) | 3 (16.7%) |
| GVHD prophylaxis | |||
| CSA, MTX ± ATG | 7 (63.6%) | 5 (71.4%) | 12 |
| CSA, MMF ± Cy | 2 (18.2%) | 1 (14.3%) | 3 |
| MMF, Cy | 1 (9.1%) | 1 (14.3%) | 2 |
| MTX | 1 (9.1%) | - | 1 |
| Conditioning regimen | |||
| Bu, Cy | - | 2 (28.6%) | 2 |
| Bu, Cy, VP-16 | 1 (9.1%) | - | 1 |
| Cy, ATG, TBI | 1 (9.1%) | - | None |
| Cy, TBI | 6 (54.5%) | 3 (42.9%) | 9 |
| Flu, Cy, TBI | 1 (9.1%) | - | 1 |
| Flu, TBI | 1 (9.1%) | 1 (14.3%) | 2 |
| Thiotepa, Flu, TBI | 1 (9.1%) | 1 (14.3%) | 2 |
| Time to ANC engraftment, days, median (range) | 16 (13 - 38), n = 11 | 19 (13 - 26), n = 5 | 17 (13 - 38), n = 16 |
| Time to ANC engraftment, days, median (range) | 23 (14 - 96), n = 9 | 22 (20 - 26), n = 5 | 22.5 (14 - 96), n = 14 |
| Acute GVHD (+) | 3 of 11 (27.3%) | 2 of 7 (28.6%) | 5 of 18 (27.8%) |
| Skin | 3 | 1 | 4 |
| Liver | 1 | - | 1 |
| Gut | 1 | 1 | 2 |
| Transplant related toxicity (within day + 100) | |||
| Mucositis | 5 (45.5%) | 1 (14.3%) | 6 (33.3%) |
| Interstitial pneumonia | 1 (9.1%) | 1 (14.3%) | 2 (11.1%) |
| Infections | |||
| Bacterial | 3 (27.3%) | 3 (42.9%) | 6 (33.3%) |
| Viral | 7 (63.6%) | 1 (14.3%) | 8 (44.4%) |
| Fungal | - | - | None |
| Seizures | - | - | None |
| Veno-occlusive disease | 1 (9.1%) | - | 1 (5.6%) |
| Hemorrhagic cystitis | 3 (27.3%) | - | 3 (16.7%) |