Figures
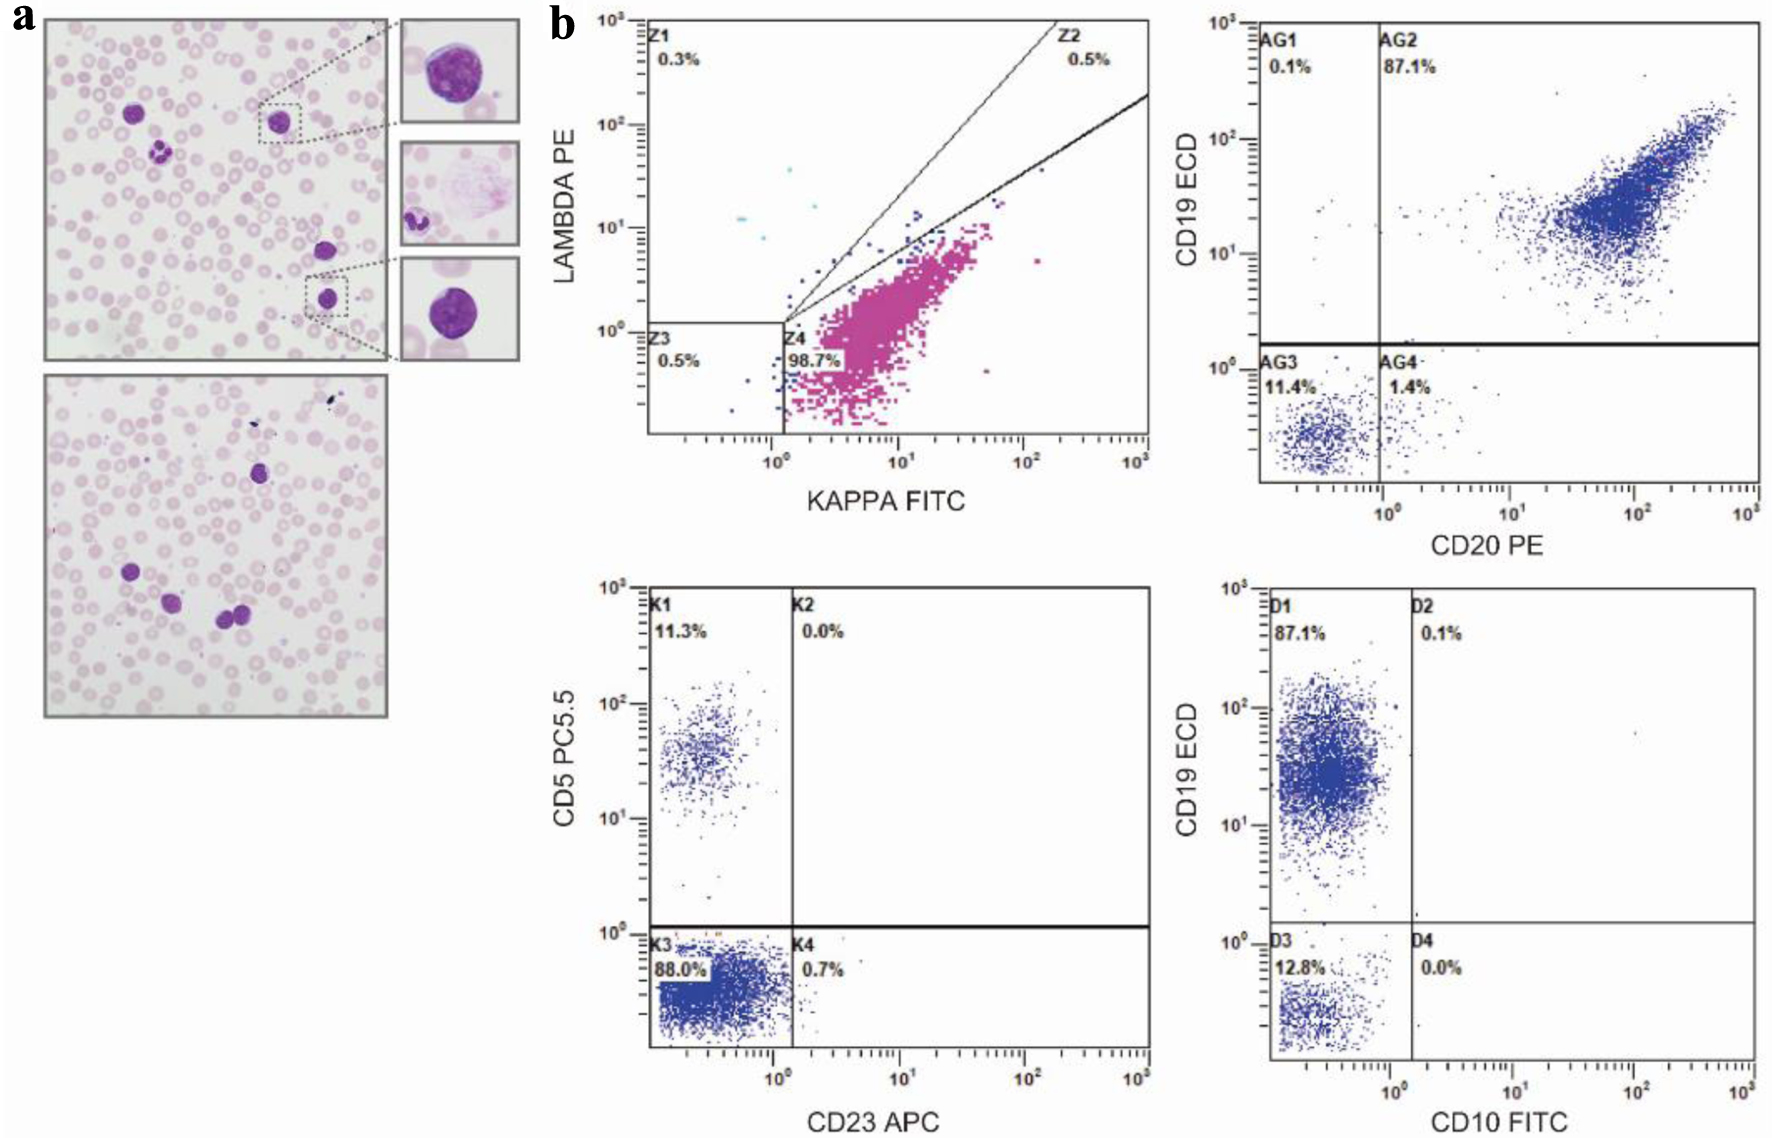
Figure 1. Peripheral blood smear and flow cytometry. (a) Representative, × 50 oil immersion microscopy of the peripheral blood smear - with digitally enlarged × 10 insets - demonstrating small- to moderate-sized lymphoid cells with scant to moderate cytoplasm, round to slightly irregular nuclei, and clumped chromatin. Middle inset, representative smudge, or basket cell present throughout smear. (b) Peripheral blood immunophenotype by flow cytometry demonstrating a monoclonal kappa B-cell population (top, left plot), with strong expression of CD19, moderate expression of CD20 (top, right panel), negative expression of CD5, and negative expression of CD23 (bottom, left panel) and CD10 (bottom, right panel).
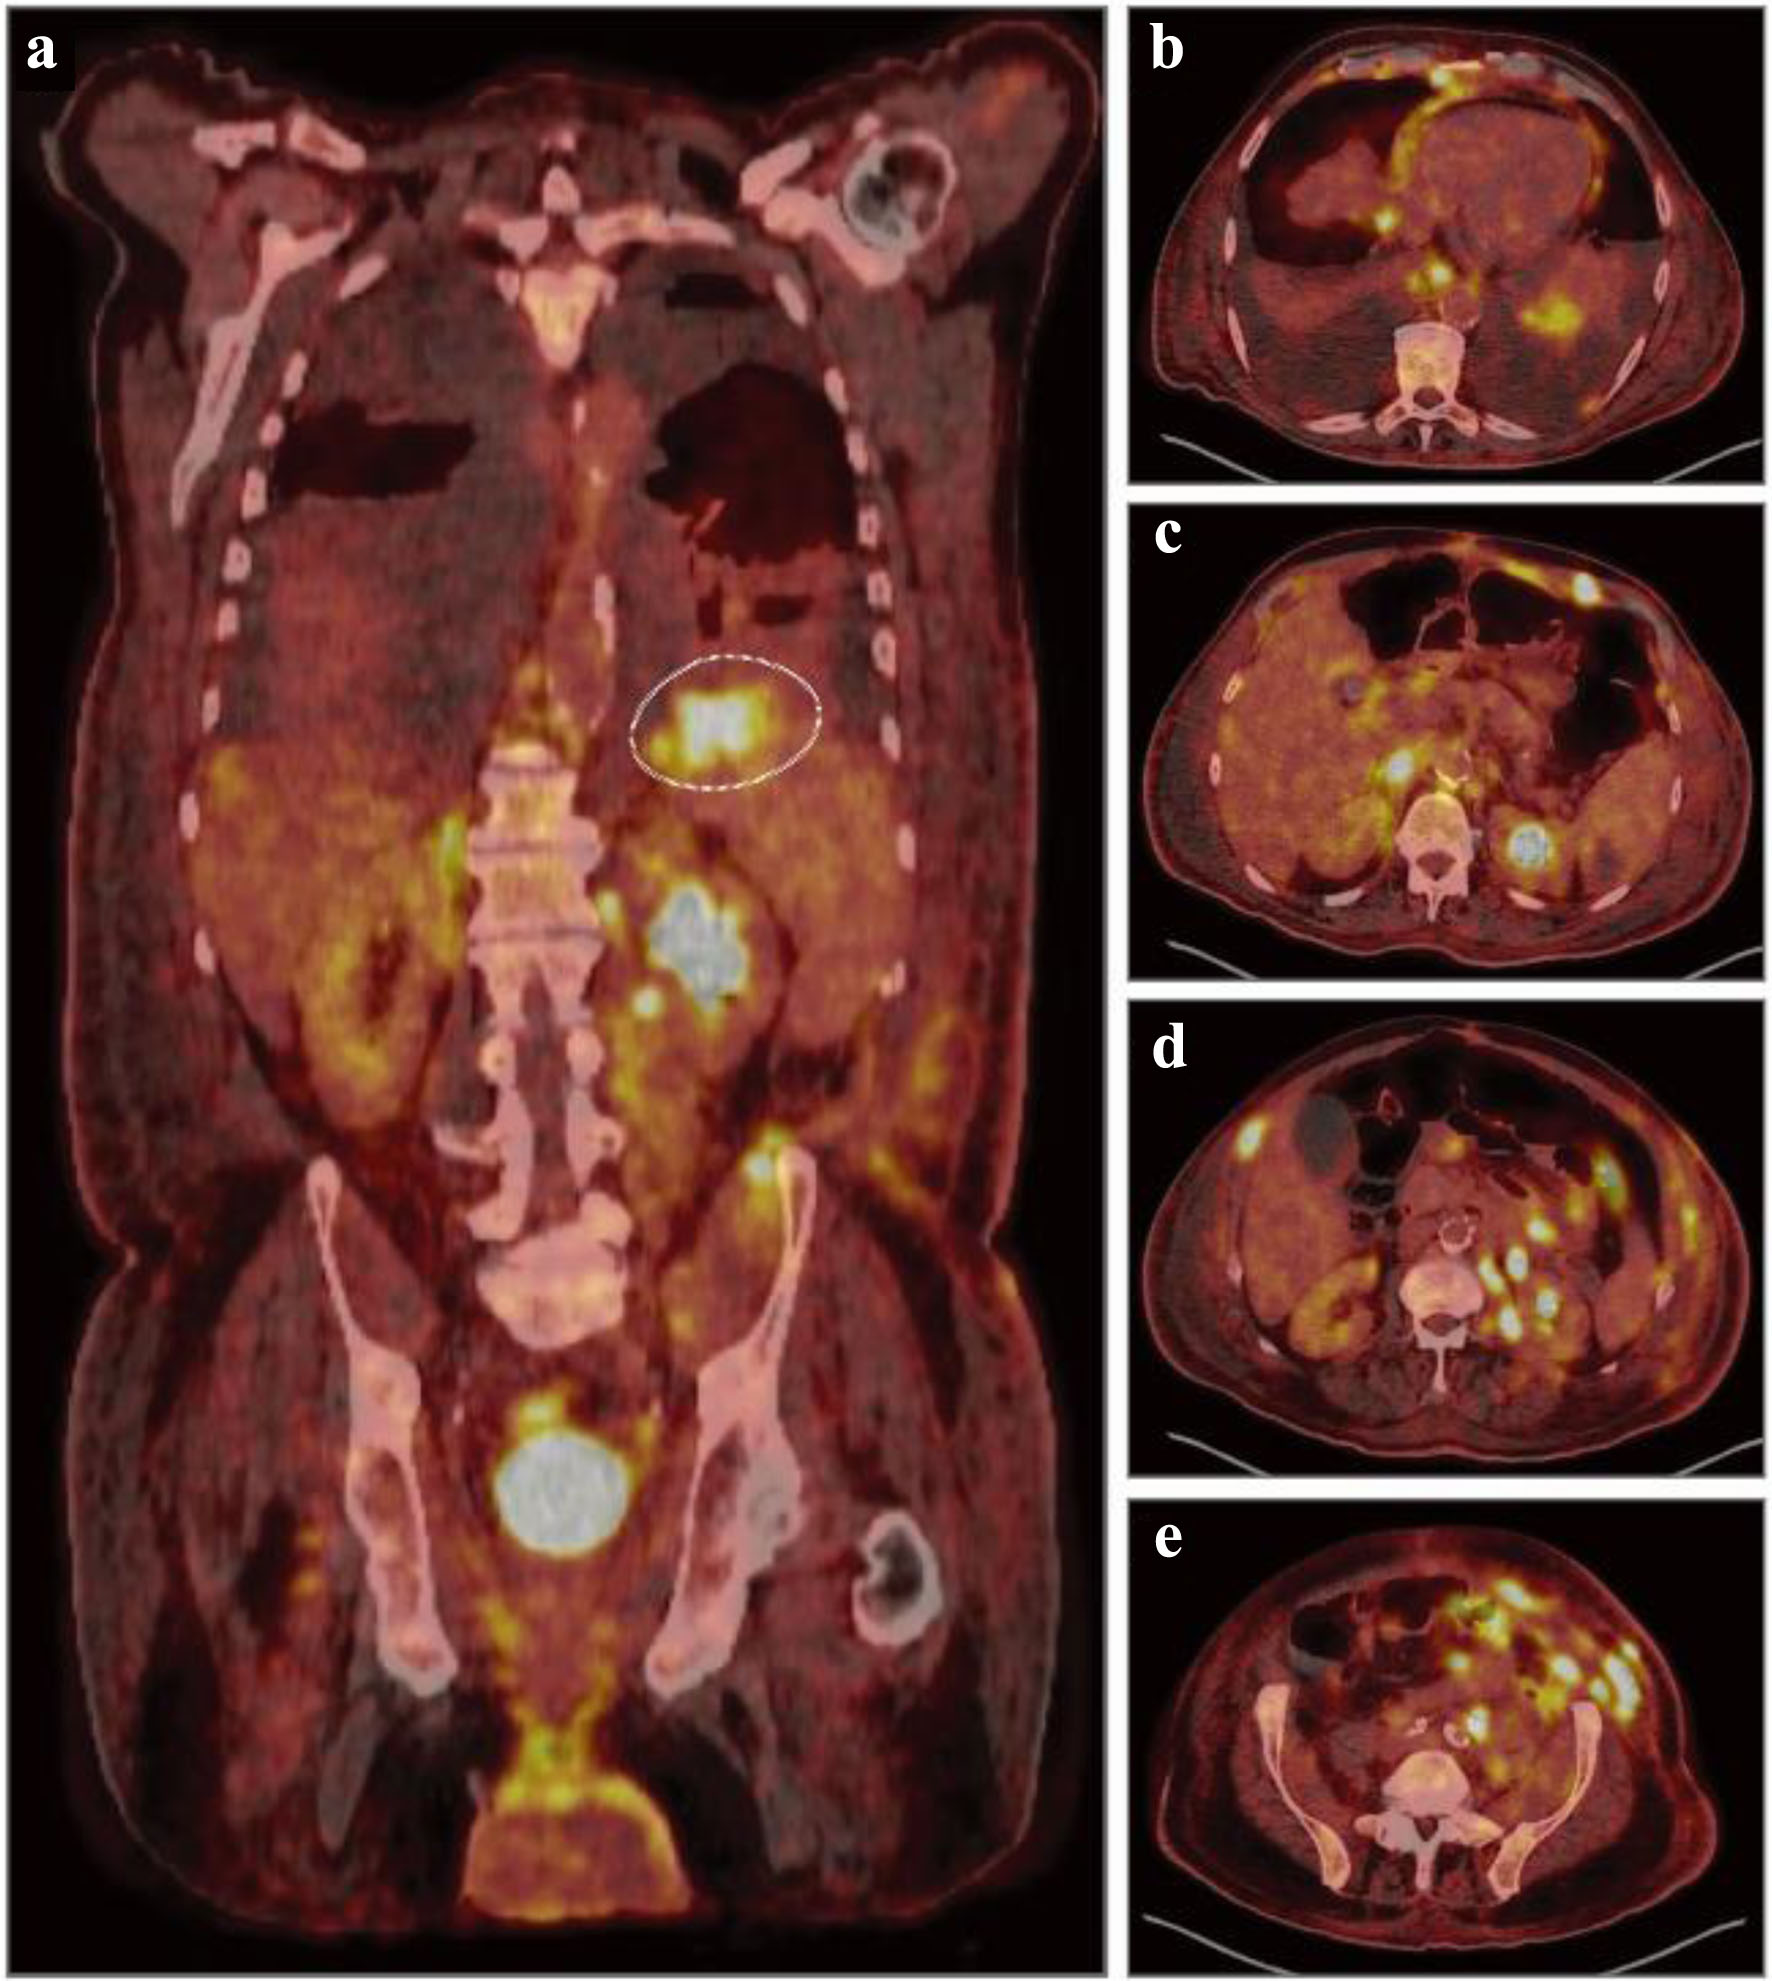
Figure 2. Diagnostic, fluorodeoxyglucose (FDG) positron emission tomography combined with computed tomography (PET-CT). (a) Representative coronal PET-CT image demonstrating diffuse uptake and hypermetabolic foci throughout the liver, spleen, kidneys, bowel, left iliac chain and inguinal region concerning for malignant involvement. Dashed circle indicating a hypermetabolic focus with a maximum standardized uptake value (SUV) of 10.0 in the superior splenic pole. (b-e) Representative axial, nonsequential PET-CT images demonstrating numerous hypermetabolic foci throughout the bilateral lower lobes, mediastinal pleura, esophagus, liver, kidney, abdominal wall, peritoneal cavity, and pelvic wall concerning for malignant involvement.
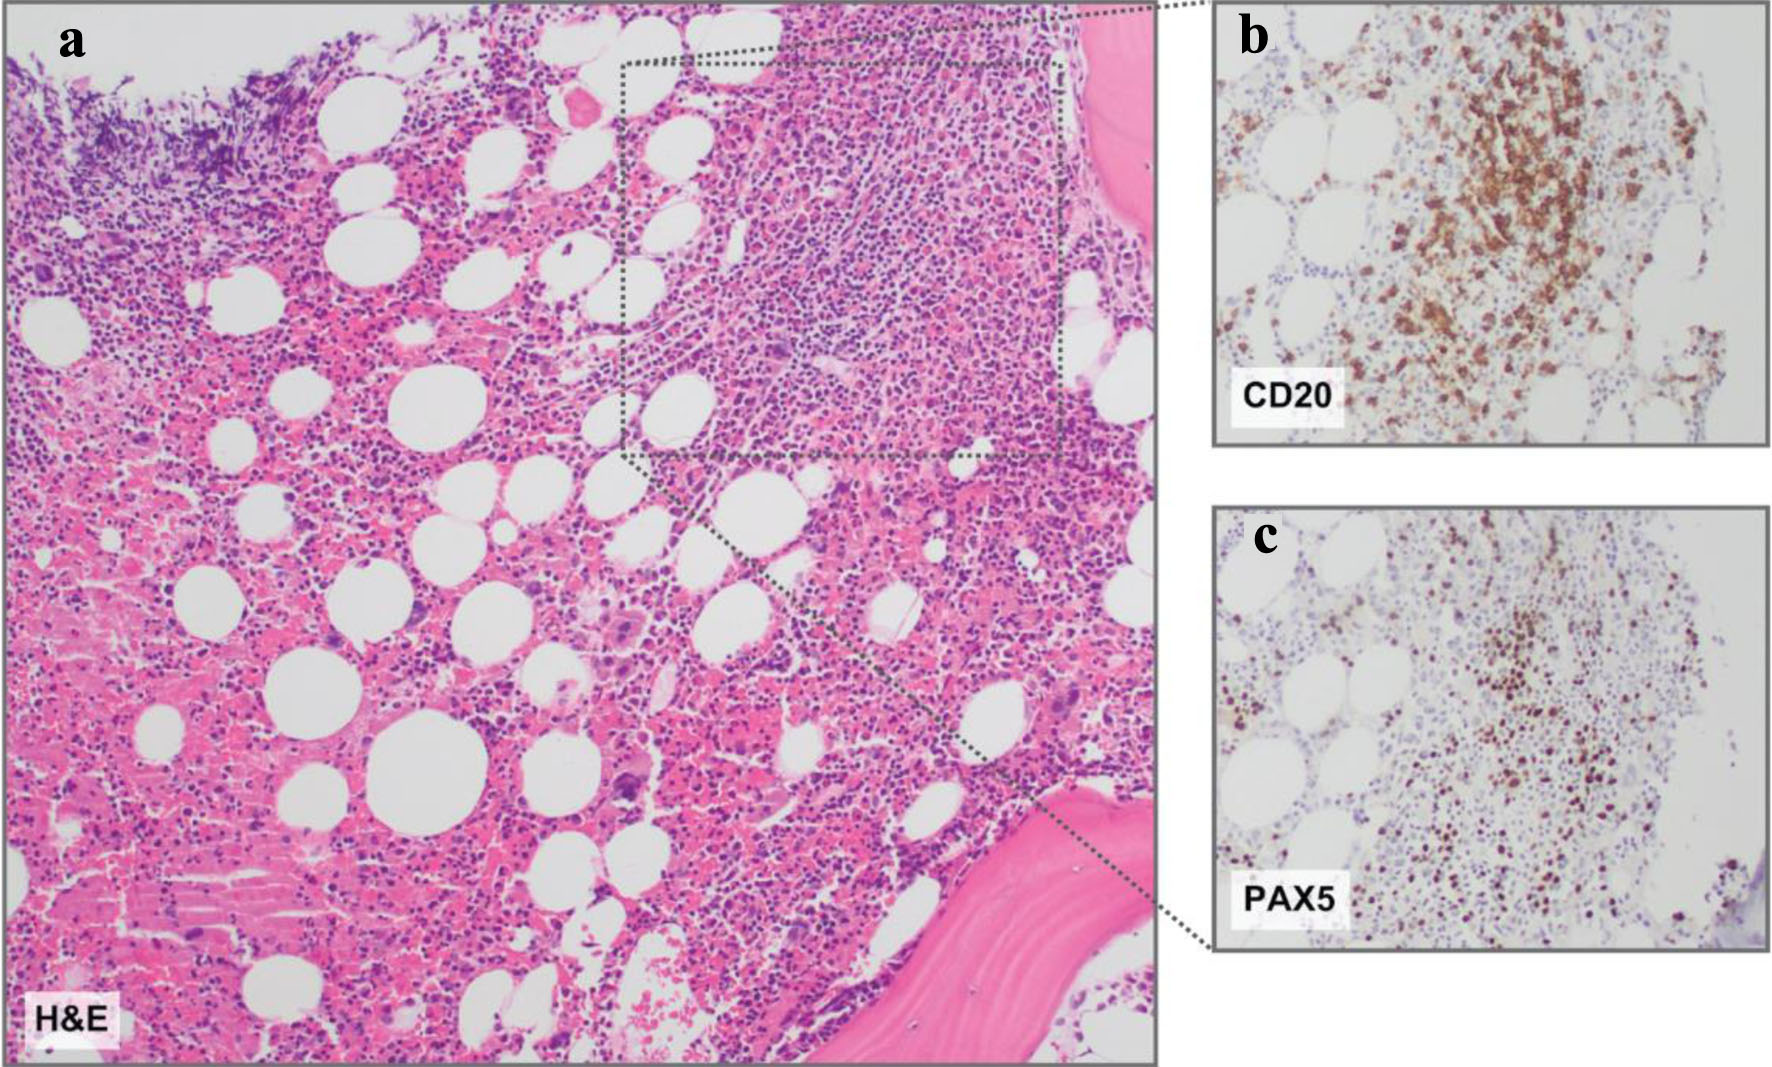
Figure 3. Bone marrow histopathology. (a) Representative hematoxylin and eosin (H&E) stain revealing a slightly nodular and interstitial lymphoid infiltrate comprised of small lymphoid cells. (b) CD20 and (c) PAX5 immunohistochemistry insets demonstrating B-cell antigens on the nodular and interstitial lymphoid infiltrate comprised of small lymphoid cells. Magnification: all, × 10.
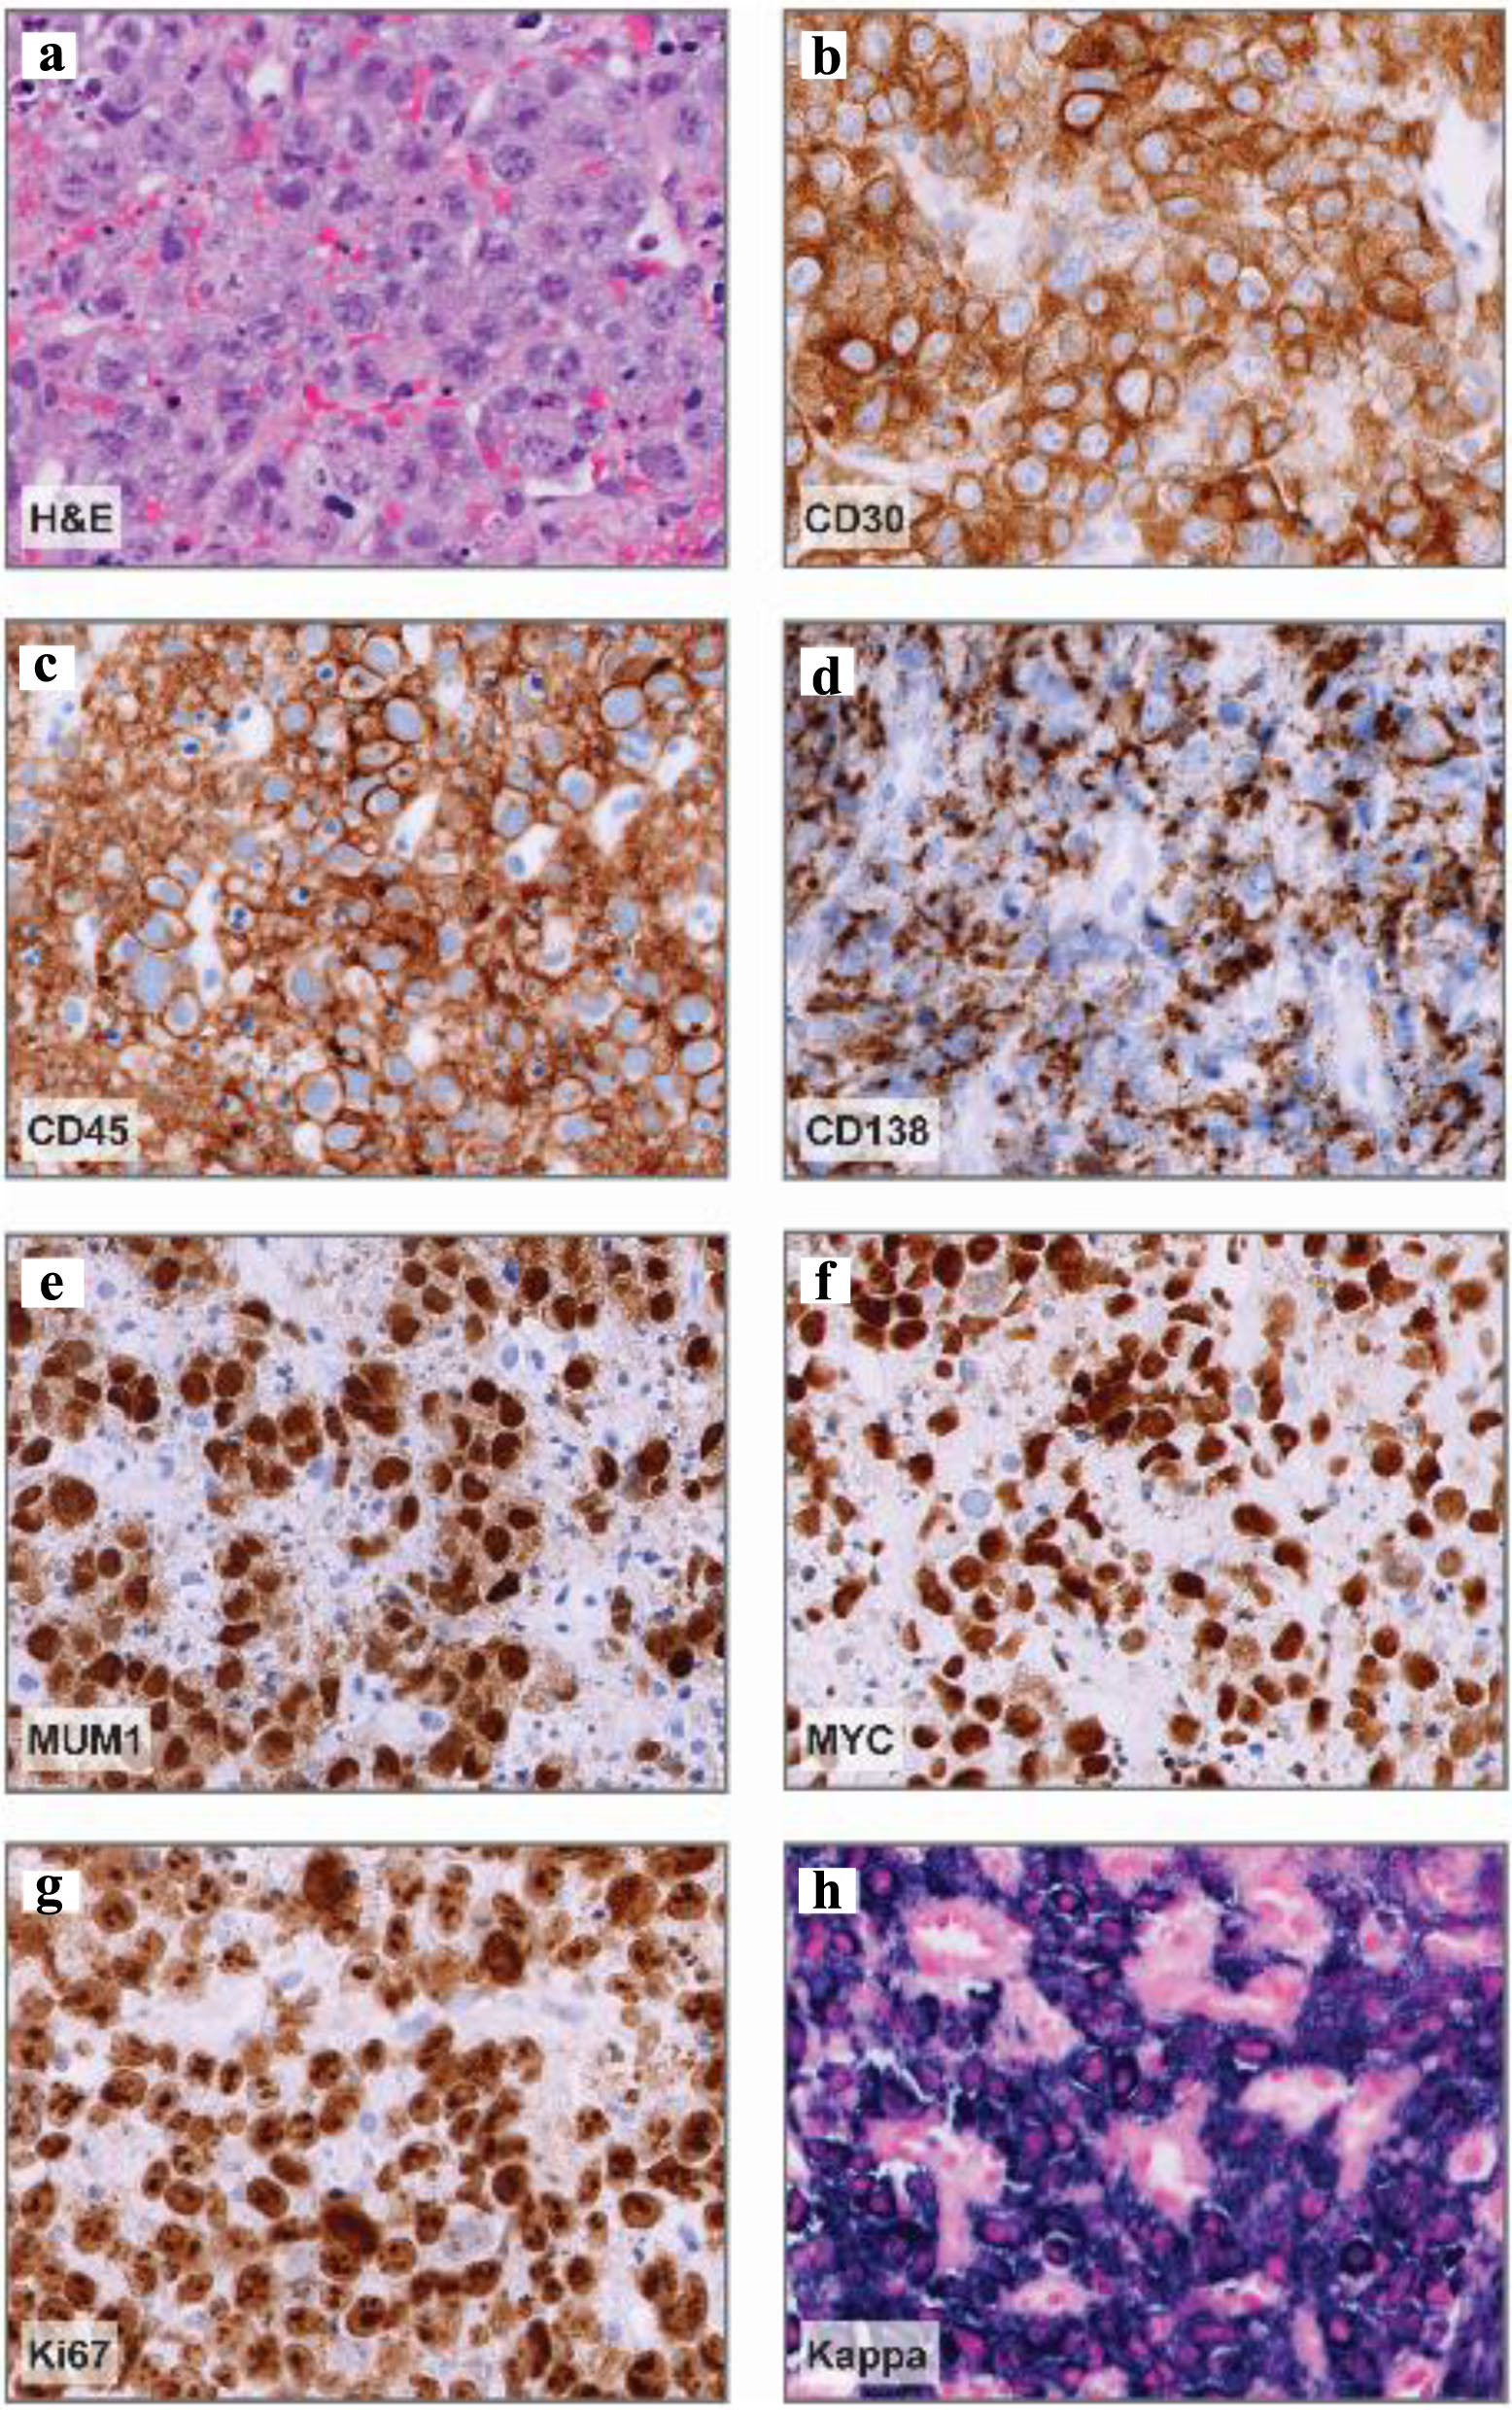
Figure 4. Abdominal nodule histopathology. (a) Representative hematoxylin and eosin (H&E) stain demonstrating large, pleomorphic cells with prominent nucleoli and vesicular chromatin. (b-e) Representative CD30, CD45, CD138, and MUM1 immunohistochemistry images demonstrating positive staining in a vast majority of neoplastic cells (about 95%) and variable CD138 expression. (f) MYC immunohistochemistry demonstrating diffuse expression in neoplastic cells. (g) Ki-67 immunohistochemistry, proliferation index: > 90%. (h) Kappa in situ hybridization denoting kappa-restricted, neoplastic cells. Magnification: all, × 40.
Table
Table 1. Cytogenetics and Next-Generation Sequencing Results
| Study | Specimen | Karyotype | FISH |
|---|
| Cytogenetics | Bone marrow aspirate | 46,XY,del(7)(q32q34),t(8;14;18)(q24.2;q32.3;q21),t(9;14)(p13;q32.3)[cp20] | Interphase FISH: positive for IGH-MYC rearrangement and positive for IGH-BCL2 rearrangement
Metaphase FISH: MYC, BCL2 on der(8)t(8;14;18), IGH, MYC on der(14)t(8;14;18); BCL2, IGH on der(18)t(8;14;18); IGH on chromosomes 9 and 14 of t(9;14)a |
| Cytogenetics | Abdominal nodule | - | Signals consistent with MYC rearrangement, BCL2 equivocal, BCL6 negative |
| Study | Specimen | Gene | Alteration | Domain |
|---|
| aRearrangement partner unknown, breakpoint on chromosome 9 suggests IGH-PAX5 t(9;14) rearrangement. bPoint mutation not previously reported. cEvaluated genes without alterations not included. MYC: Myc proto-oncogene protein; BCL2: B-cell lymphoma 2; BCL6: B-cell lymphoma 6; FISH: fluorescence in situ hybridization; KLF2: Kruppel-like factor 2; POT1: protection of telomeres 1; VAF: variant allele frequencies. |
| Mutation panelc | Bone marrow | KLF2 (VAF: 54.0%) | c.821G>A (p.C274Y) | Zinc finger 1 |
| | KLF2 (VAF: 45.7%) | c.862C>G (p.H288D)b | Zinc finger 1 |
| | POT1 (VAF: 4.5%) | c.1505+7_1505+8insTGTTTT | Splice region |