Figures

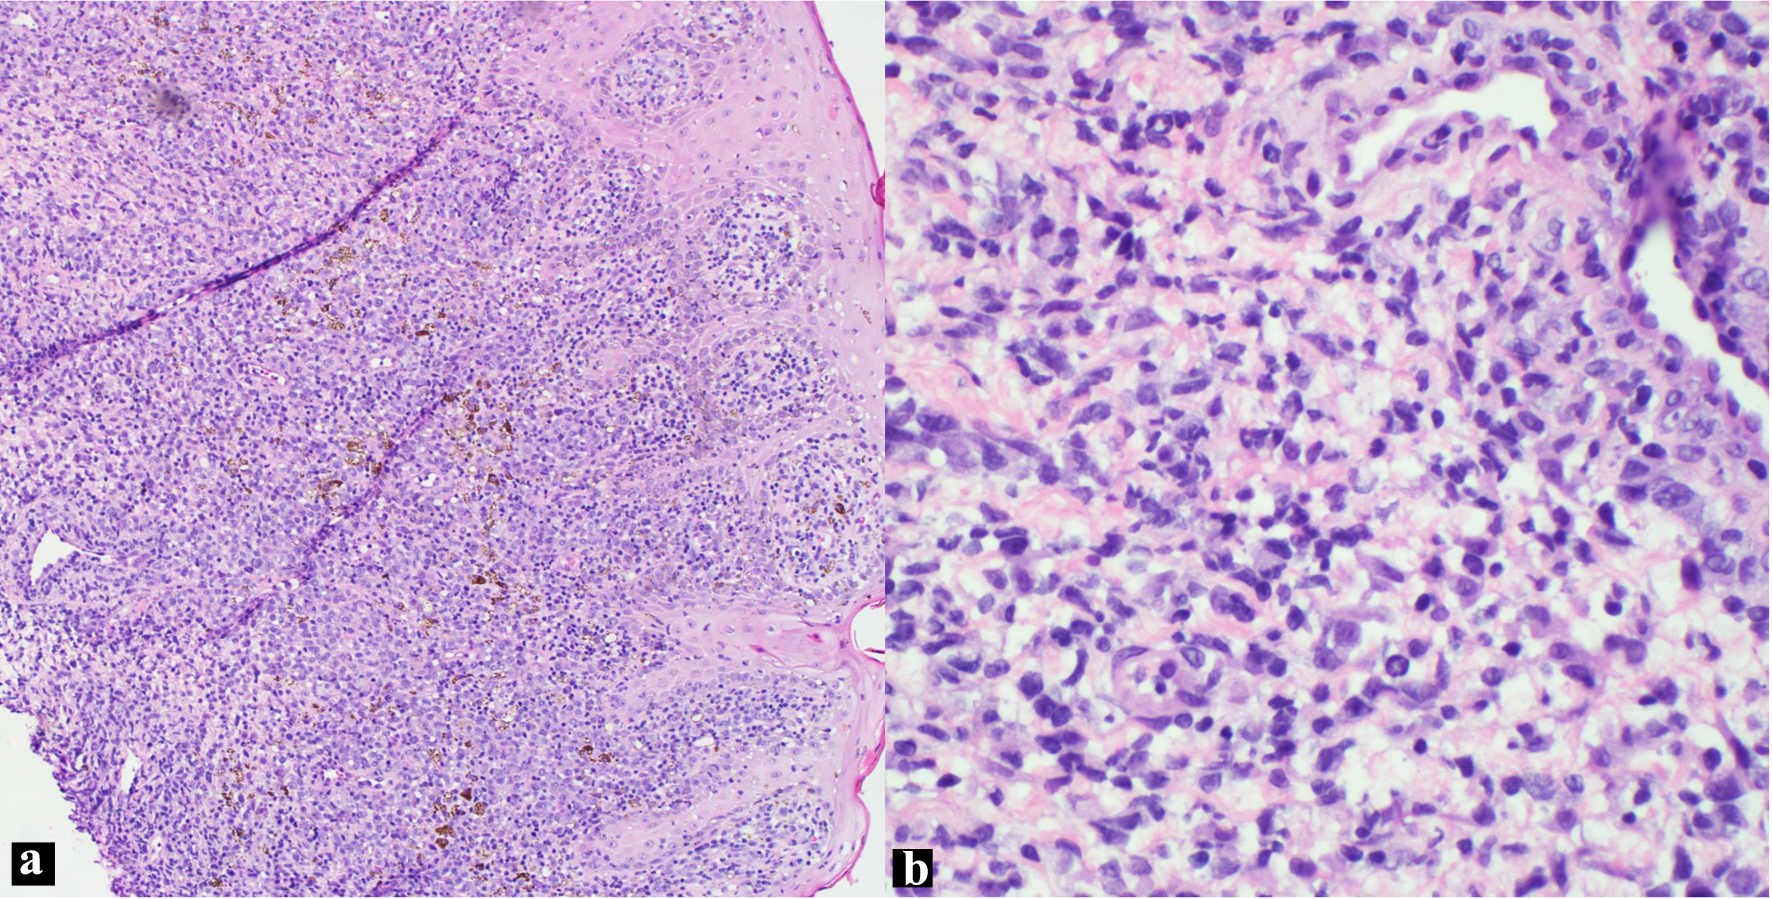
Figure 1. H&E skin biopsy (a: × 100; b: × 400 magnification), showing non-cohesive, anaplastic pleomorphic cells. H&E: hematoxylin and eosin.

Figure 2. IHC stains of skin biopsy (× 100 magnification): (a) ALK, negative; (b) CD30, positive; (c) CD2, positive; (d): CD5, positive. ALK: anaplastic lymphoma kinase; IHC: immunohistochemistry.

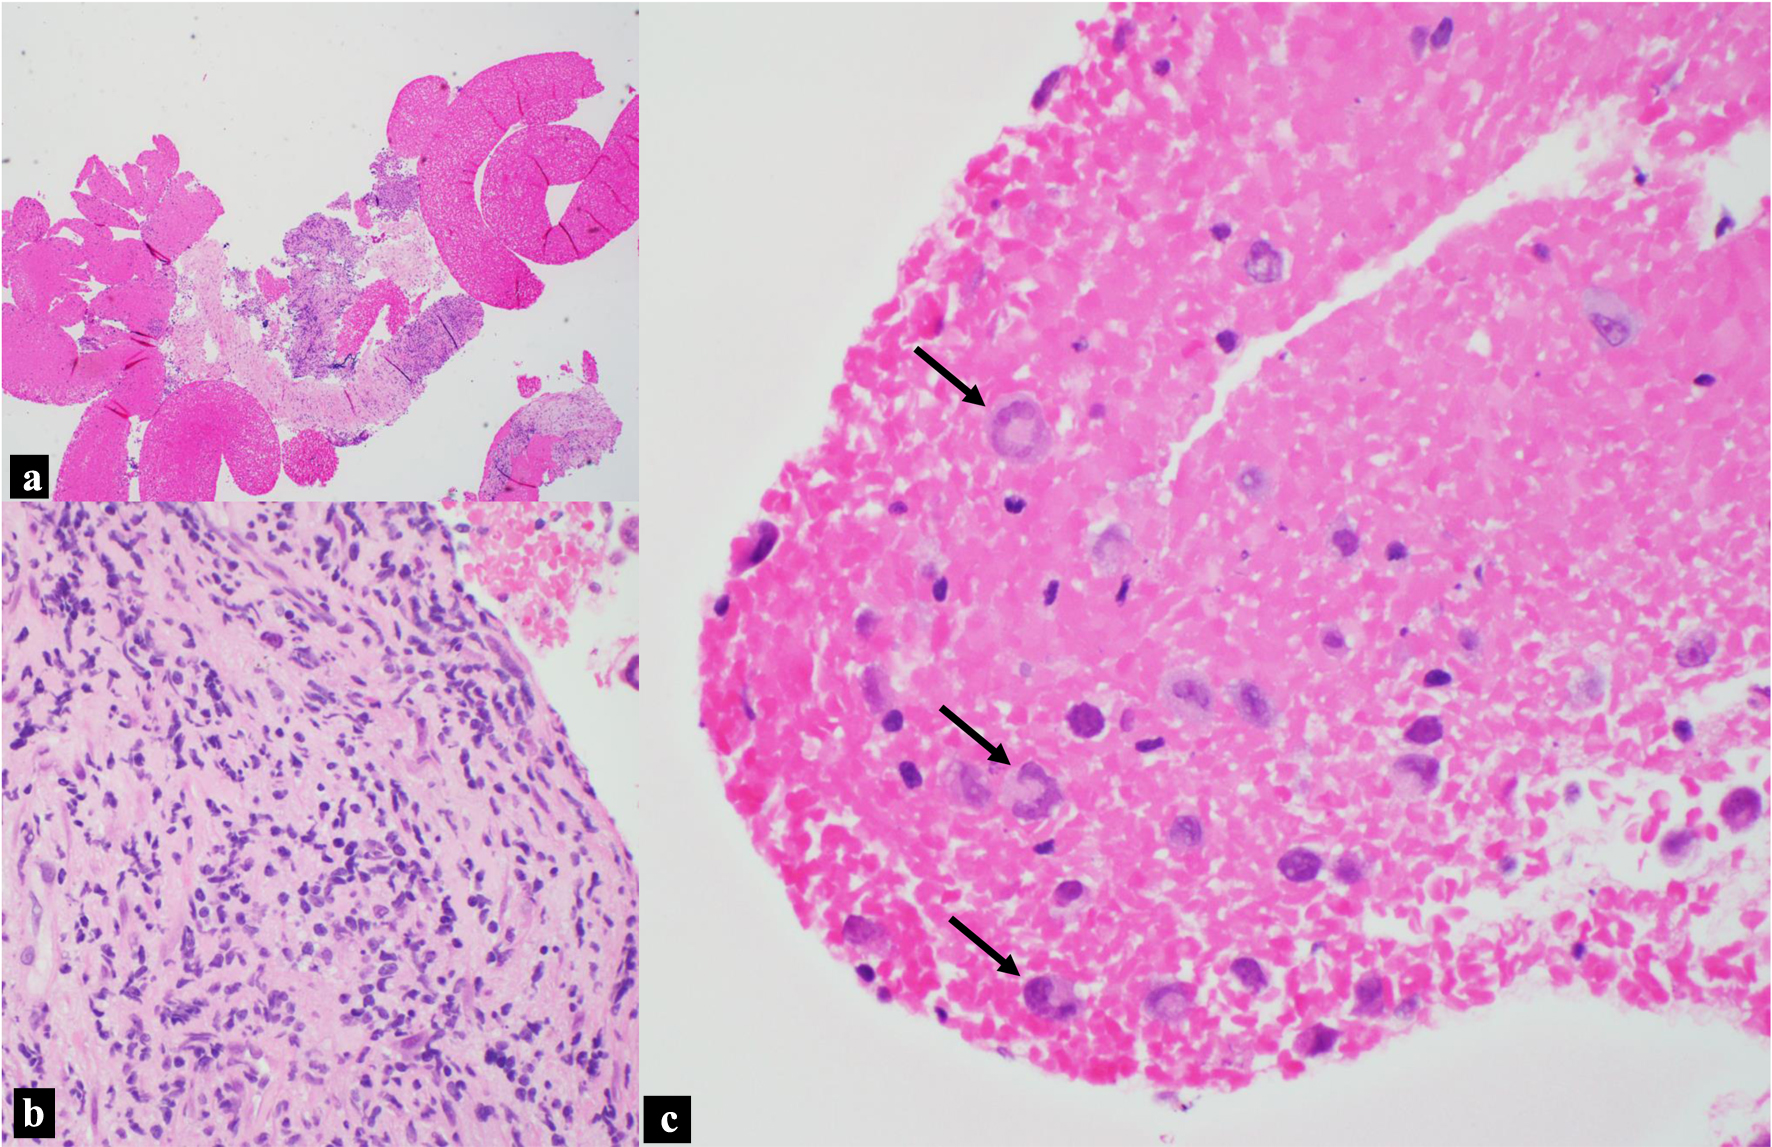
Figure 3. H&E, pancreatic head mass biopsy. (a) Blood and fibrous tissue background with focal hypercellular areas (× 40 magnification). (b) Scattered and rare small clusters of large pleomorphic cells in the background of fibrous tissue (× 400 magnification). (c) Discohesive large anaplastic “hallmark cells” indicated by black arrows, with “wreath” or “horseshoe” nuclei (× 400 magnification). H&E: hematoxylin and eosin.

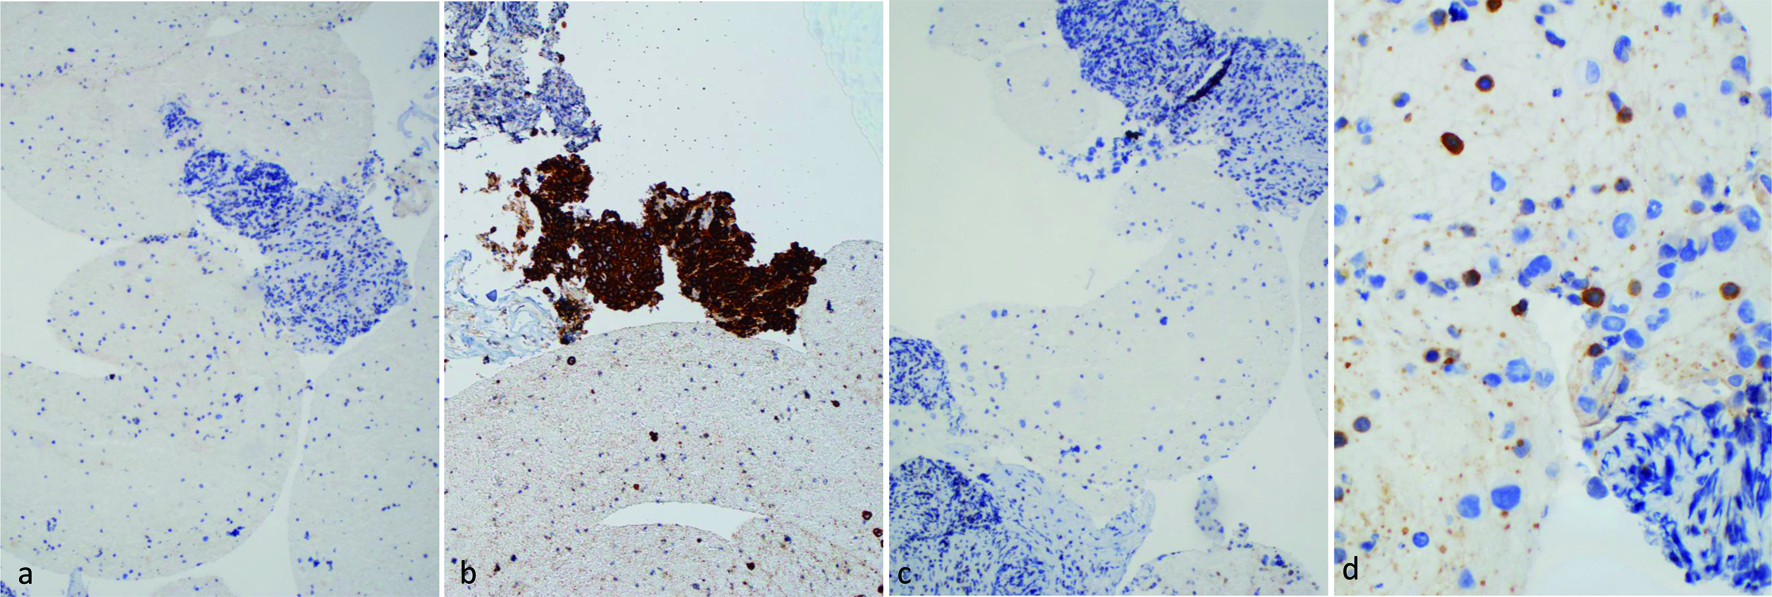
Figure 4. IHC stains of pancreatic mass biopsy (a, b & c × 100 magnification; d × 400 magnification). (a) ALK, negative; (b) CD30, positive; (c) CD3, negative; (d) CD5, negative for large lymphoma cells, with a background of scattered small lymphocytes. ALK: anaplastic lymphoma kinase; IHC: immunohistochemistry.

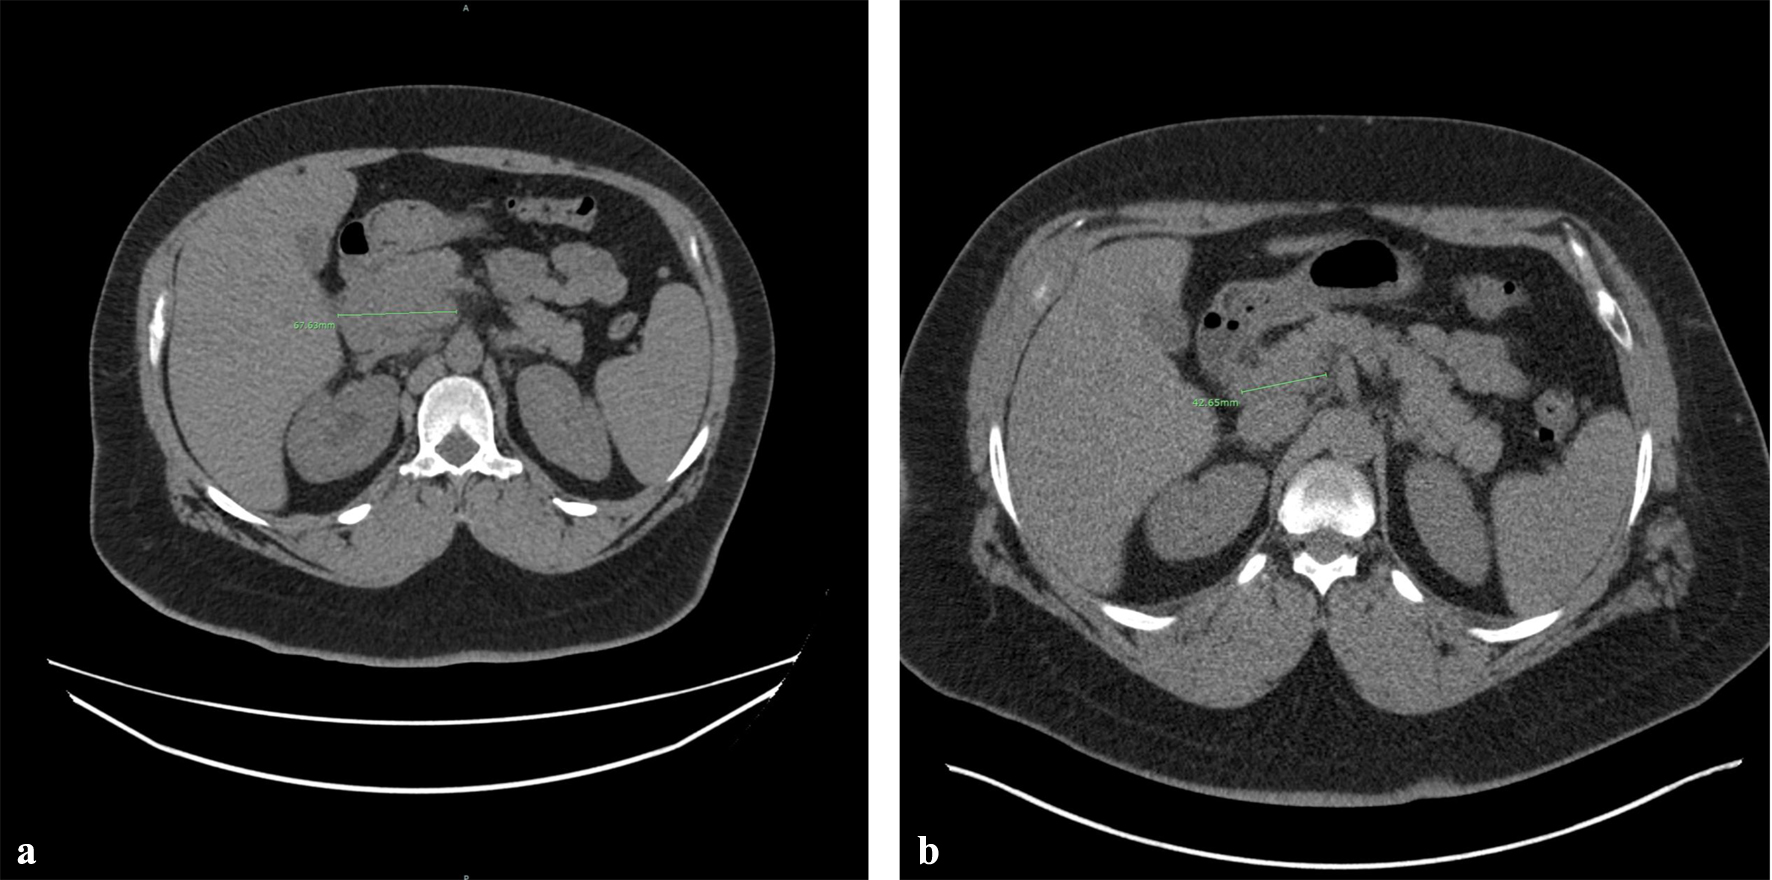
Figure 5. Therapeutic response after three cycles of BV + CHP treatment. CT imaging demonstrates a significant reduction in the size or the pancreatic head mass, with measurements decreasing from 67.63 mm (a) to 42. 65 mm (b). BV + CHP: brentuximab vedotin + cyclophosphamide-doxorubicin-prednisone; CT: computed tomography.


