Figures
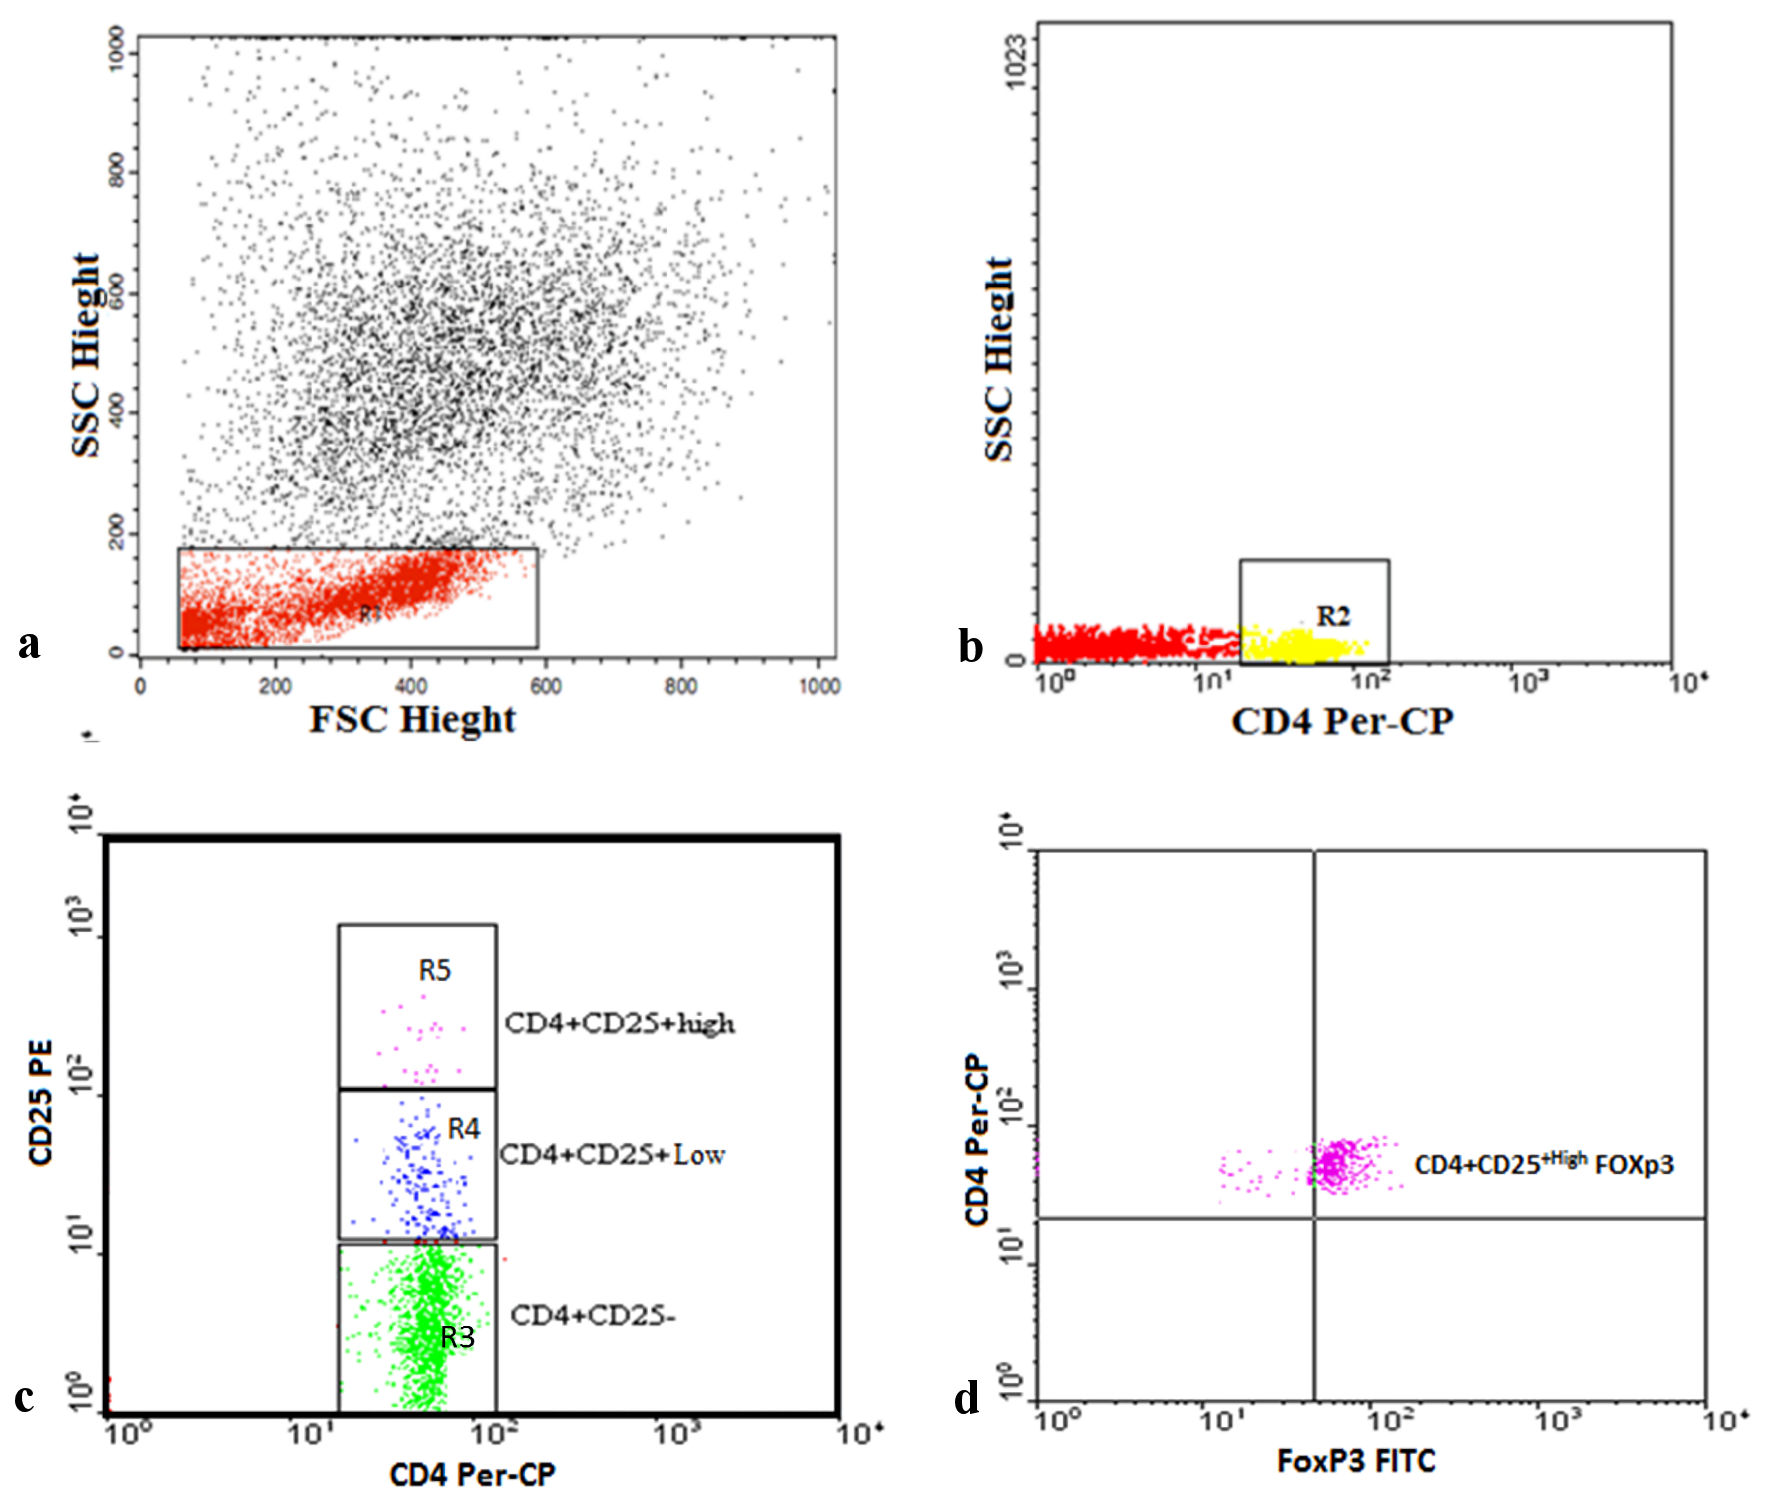
Figure 1. Representative plots showing flow cytometric detection of regulatory T cells in transfusion-dependent thalassemia (TDT) patients. (a) The lymphocyte population was defined on a forward scatter (FSC) and side scatter (SSC) histogram (R1). (b) The expression of CD4 on the lymphocytes population was detected, then CD4+ cells were gated (R2) for further analysis of CD25. (c) Three gates were drawn to define CD4+CD25- cells (R3), CD4+CD25+low cells (R4), and CD4+CD25+high cells (R5). (d) The percentage of CD4+CD25+highFoxp3+ cells (regulatory T cells) was then assessed. Foxp3: forkhead box protein 3; FITC: fluorescein isothiocyanate; PE: phycoerythrin; Per-CP: peridinium-chlorophyll-protein.
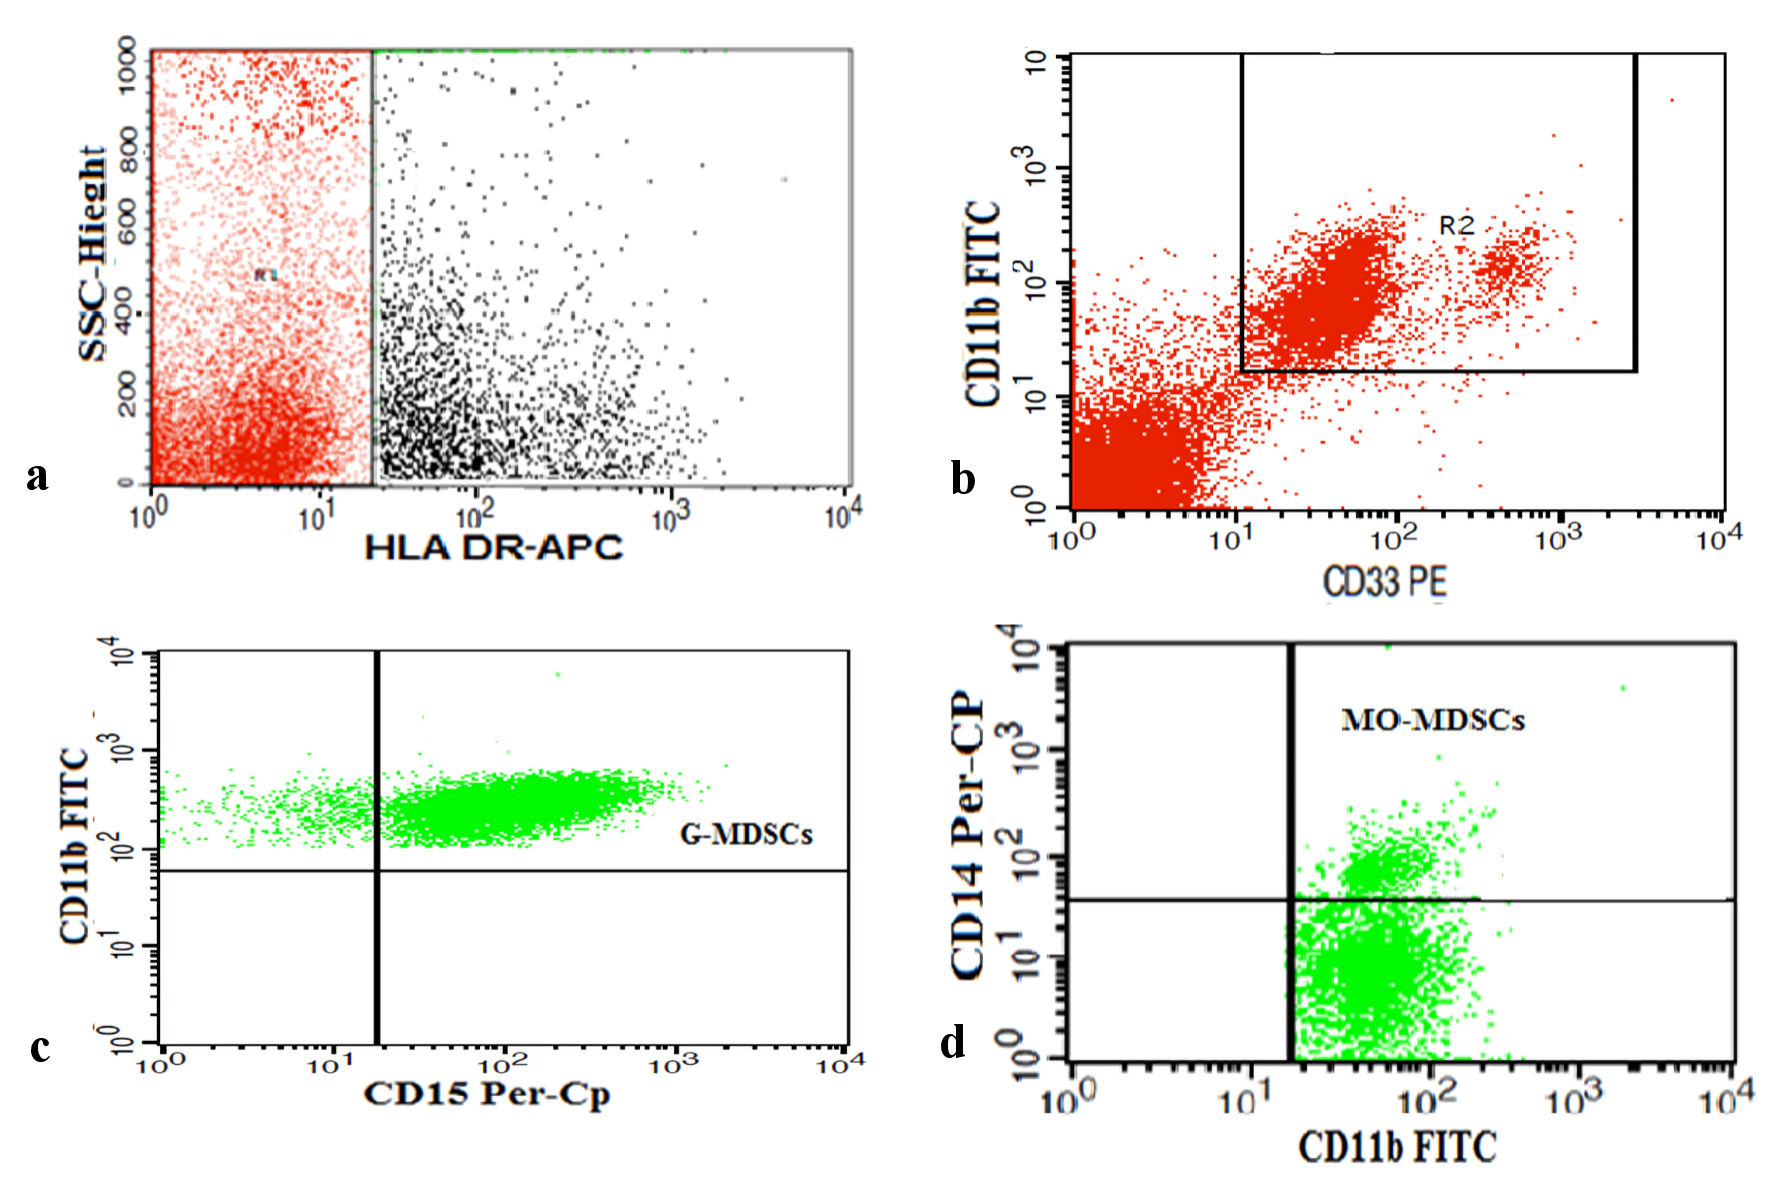
Figure 2. Representative plots showing flow cytometric detection of myeloid-derived suppressor cells (MDSCs) in transfusion-dependent thalassemia (TDT) patients. (a) HLA-DR negative cells (R1) were selected from HLA-DR and side scatter histogram. (b) HLA-DR negative cells were assessed for their expression of CD33 and CD11b to detect total MDSCs (R2) (HLA-DR-CD33+CD11b+). (c, d) Total MDSCs were assessed for their expression of CD15 and CD14 to detect polymorphonuclear MDSCs (PMN-MDSCs) (HLA-DR-CD33+CD11b+CD15+) and monocytic MDSCs (MO-MDSCs) (HLA-DR-CD33+CD11b+CD14+). HLA-DR: human leukocyte antigen - DR isotype; Foxp3: forkhead box protein 3; FITC: fluorescein isothiocyanate; PE: phycoerythrin; Per-CP: peridinium-chlorophyll-protein; SSC: side scatter.
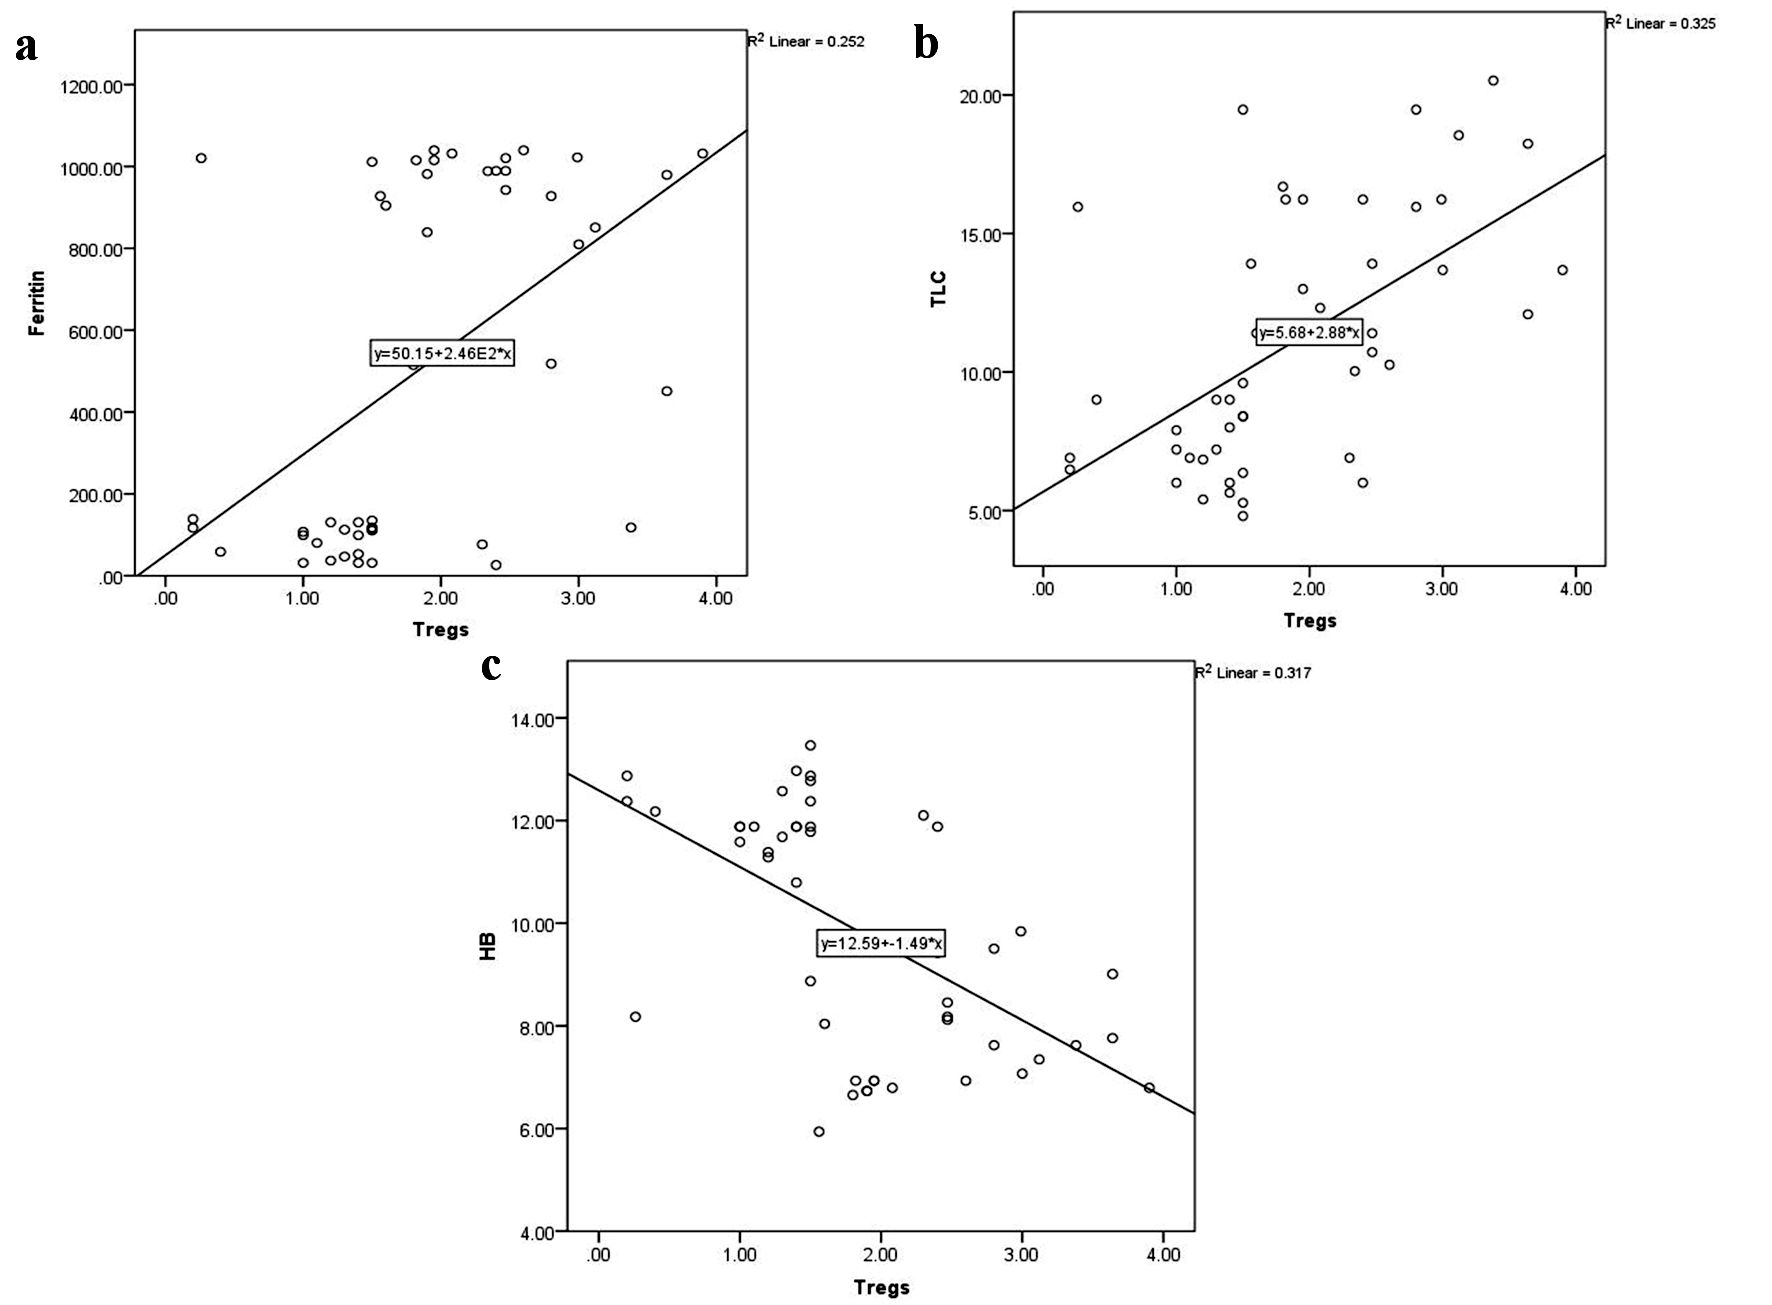
Figure 3. Correlations of CD4+CD25highFoxP3+ Tregs with serum ferritin level (a), total leukocyte count (TLC) (b), and hemoglobin (HB) level (c). Foxp3: forkhead box protein 3; Tregs: regulatory T cells.
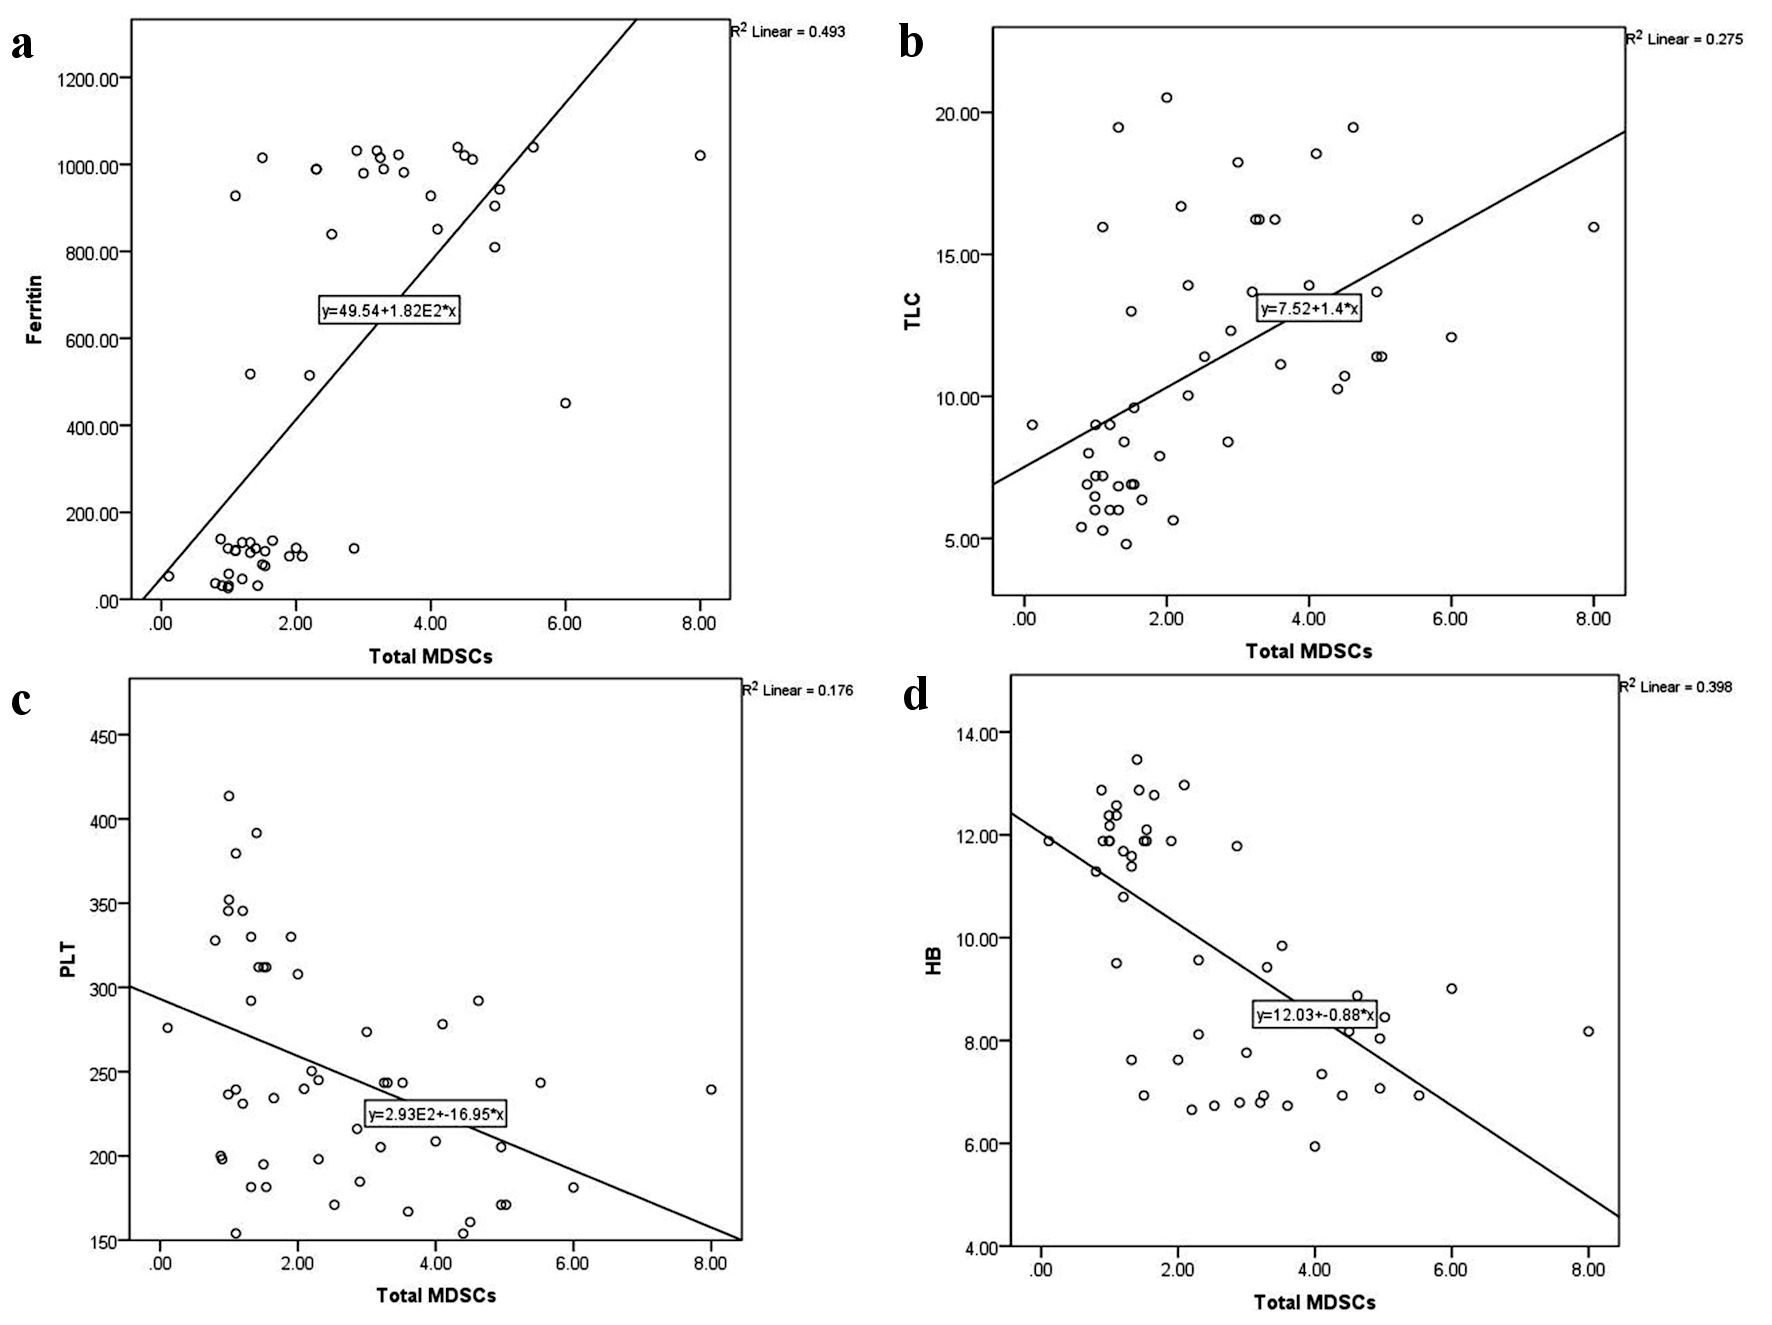
Figure 4. Correlations of total myeloid-derived suppressor cells (MDSCs) with serum ferritin level (a), total leukocyte count (TLC) (b), platelet (PLT) count (c), and hemoglobin (HB) level (d).
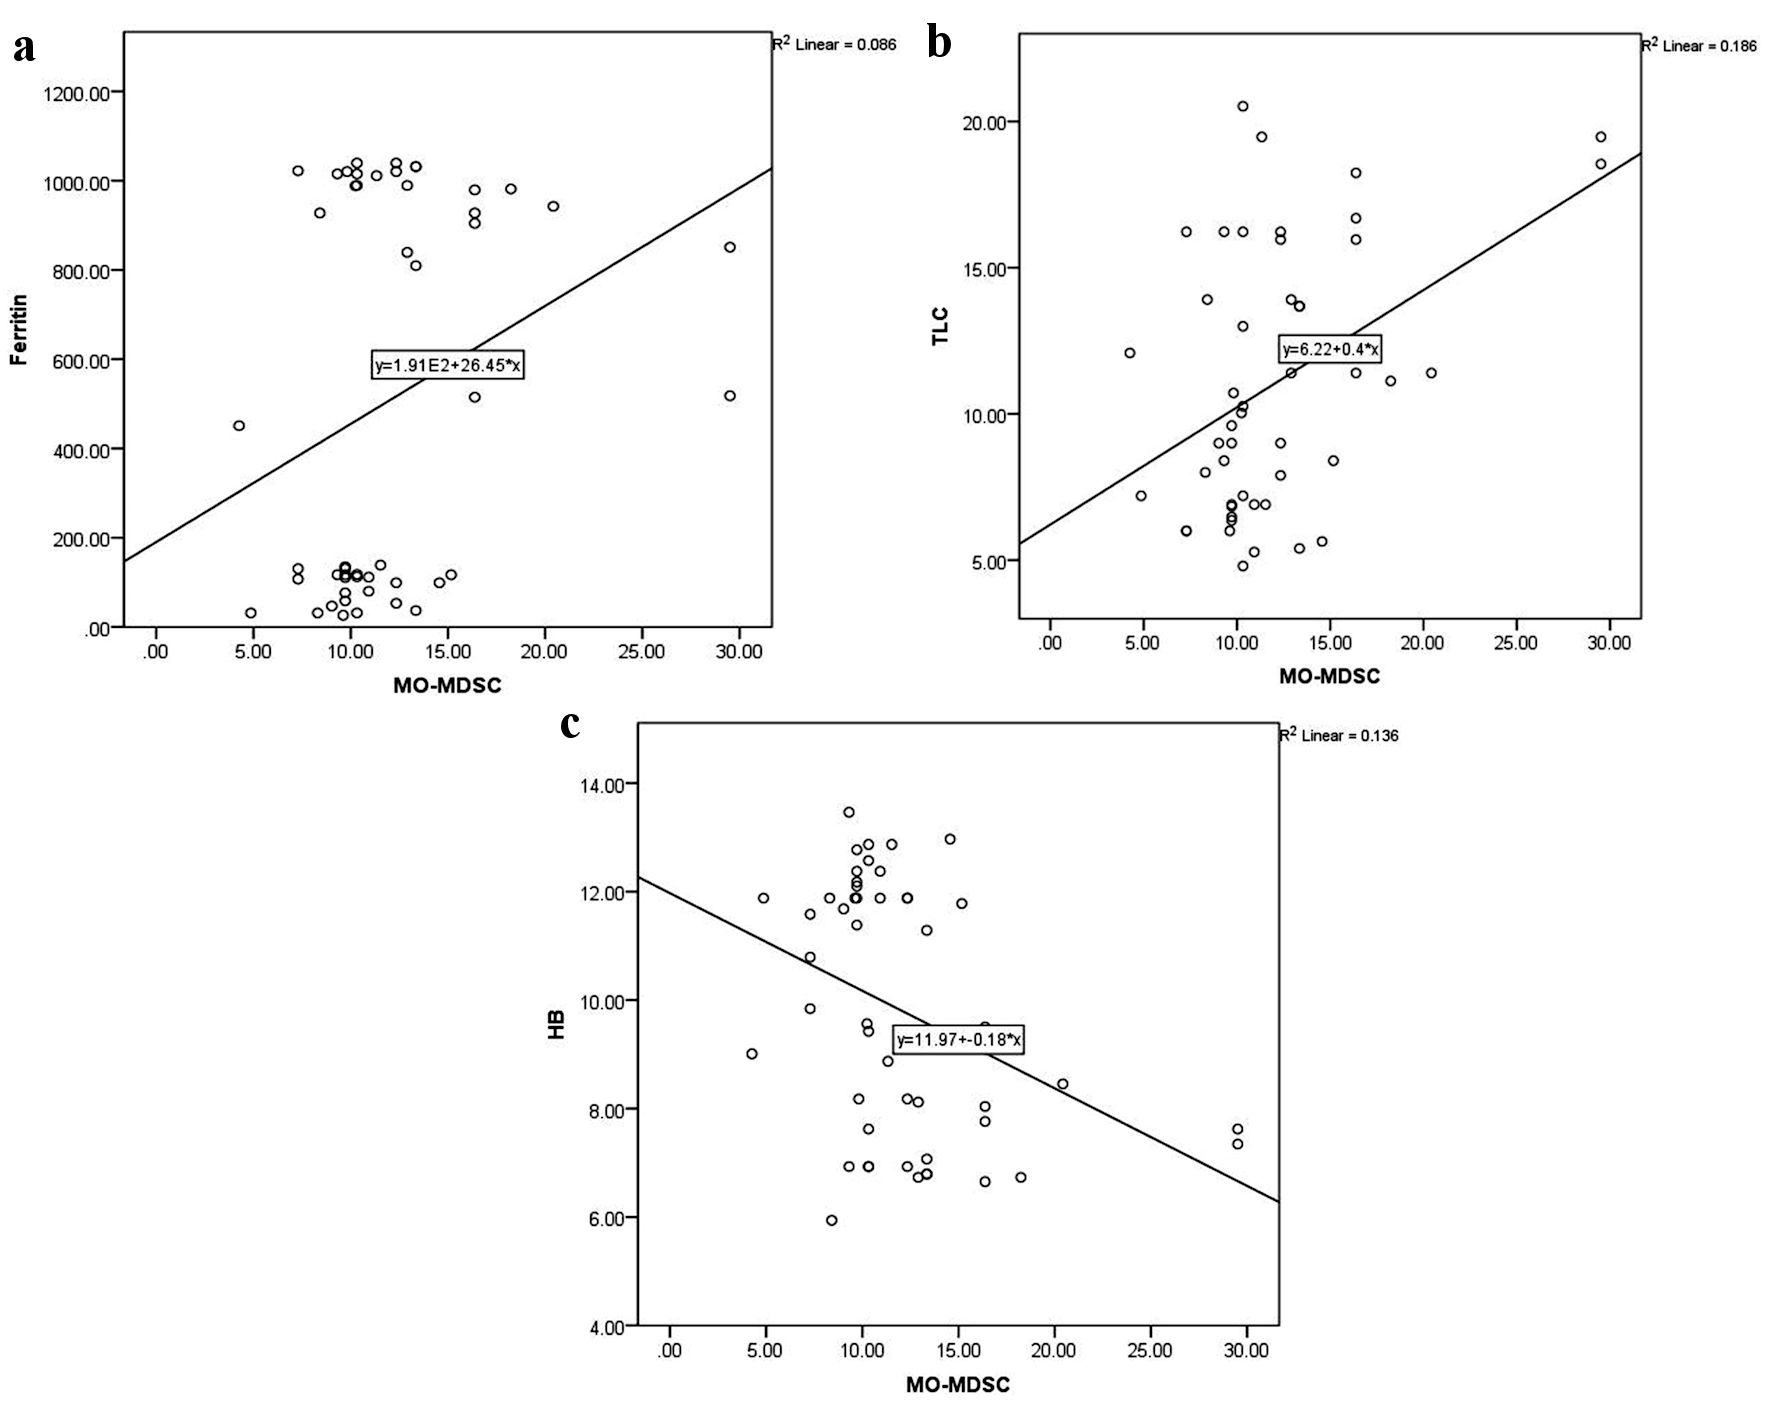
Figure 5. Correlations of monocytic-myeloid-derived suppressor cells (MO-MDSCs) with serum ferritin level (a), total leukocyte count (TLC) (b), and hemoglobin (HB) level (c).
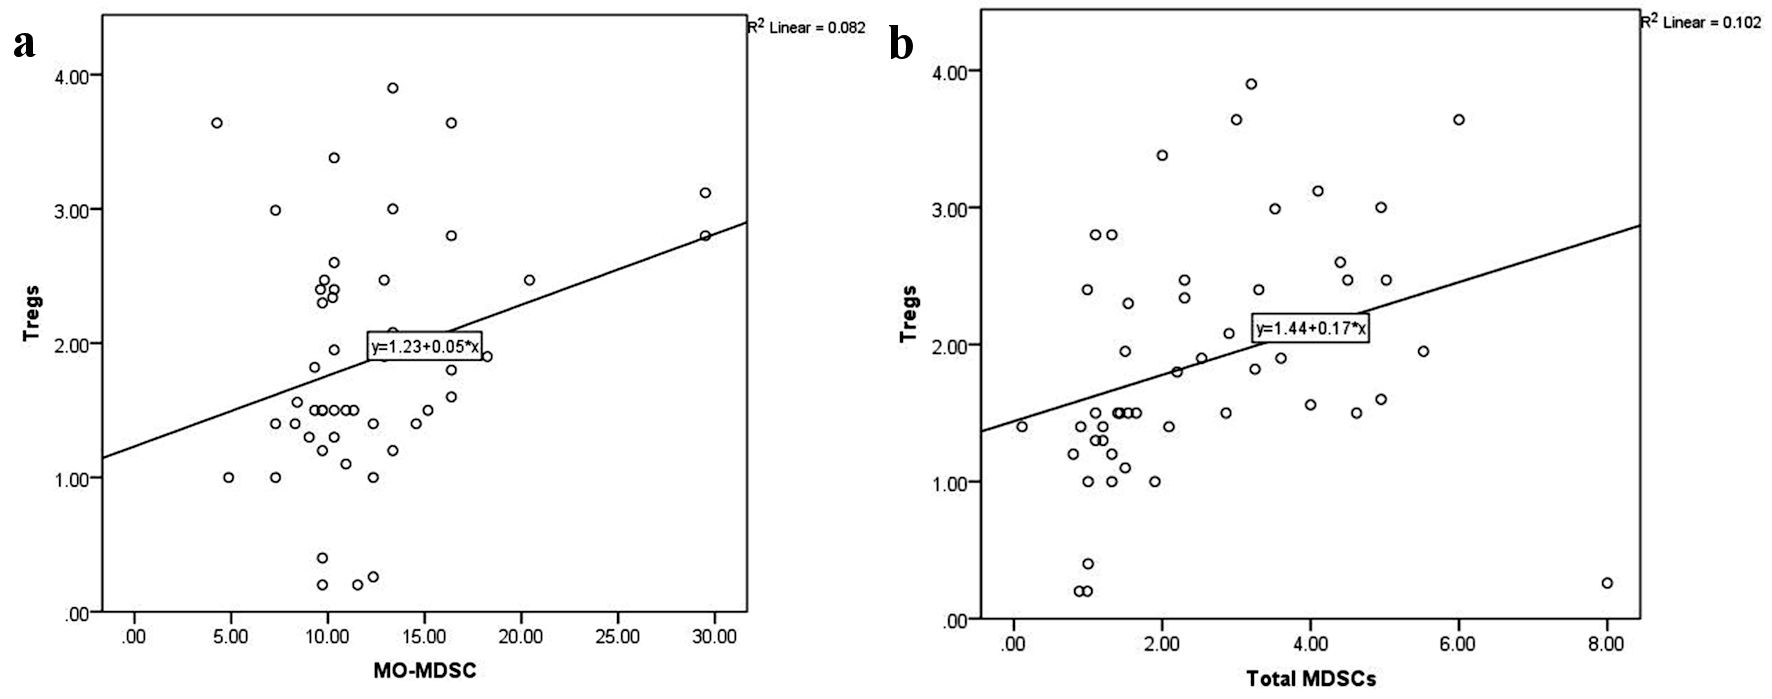
Figure 6. Correlations of CD4+CD25highFoxP3+ Tregs with monocytic-myeloid-derived suppressor cells (MO-MDSCs) (a) and total myeloid-derived suppressor cells (MDSCs) (b). Foxp3: forkhead box protein 3; Tregs: regulatory T cells.
Table
Table 1. Demographic Data and the Laboratory Investigations of All Patients
| Parameter | Patients (n = 26) | Control (n = 23) | P value |
|---|
| *P < 0.05. SD: standard deviation; Tregs: regulatory T cells; MDSCs: myeloid-derived suppressor cells; PMN-MDSCs: polymorphonuclear-myeloid-derived suppressor cells; MO-MDSCs: monocytic-myeloid-derived suppressor cells; Foxp3: forkhead box protein 3. |
| Age (year) (mean ± SD) | 8.7 ± 5 | 8.2 ± 6.3 | 0.126 |
| Sex | | | |
| Males, n (%) | 14 (54%) | 13 (50%) | 0.3 |
| Females, n (%) | 12 (46%) | 13 (50%) | |
| Total leukocyte count (× 109/L) | 14.6 ± 3.0 | 9.0 ± 3.3 | 0.0001* |
| Platelet count (× 109/µL) | 221.7 ± 45 | 310 ± 102 | 0.001* |
| Hemoglobin (g/dL) | 7.8 ± 1.0 | 13.7 ± 1.0 | < 0.001* |
| Ferritin (ng/mL) | 883.8 ± 229 | 81.0 ± 25.1 | 0.001* |
| CD4+ T cells (%) | 44.7 ± 1 | 43.95 ± 1 | 0.7 |
| CD4+CD25+ T cells (%) | 12.6 ± 0.3 | 11.6 ± 0.3 | 0.02* |
| CD4+CD25low T cells (%) | 8 ± 0.4 | 8.8 ± 0.3 | 0.2 |
| CD4+CD25high T cells (%) | 4.7 ± 0.6 | 2.9 ± 0.4 | 0.03* |
| CD4+CD25highFoxP3+ Tregs (%) | 2.4 ± 0.2 | 1.3 ± 0.1 | < 0.0001* |
| Total MDSCs (%) | 3.6 ± 0.3 | 1.3 ± 0.1 | < 0.0001* |
| PMN-MDSCs (%) | 86.2 ± 2 | 88.9 ± 0.4 | 0.3 |
| MO-MDSCs (%) | 13.7 ± 1 | 10.3 ± 0.5 | 0.009* |