
Figure 1. Linear regression and bias plots for the methods comparison (n = 261). (a) Passing-Bablok regression analysis between MINI-CUBE vs. Westergren test, defined by the equation y = 1.00 + 1.00x, intercept A 1.00 (95% CI: 0.00 - 2.00), slope B 1.00 (95% CI: 0.98 - 1.04). It was evaluated R2 of 0.94 (95% CI: 0.928 - 0.955; P < 0.001). (b) Bland-Altman test defined by the Westergren test and MINI-CUBE results (y-axis) and the mean of the two methods. The dotted lines denote the limits of the agreement (max.:19.6; min.: -16.6), and the continued line denotes the bias of 1.5. CI: confidence interval; max.: maximum; min.: minimum; SD: standard deviation.
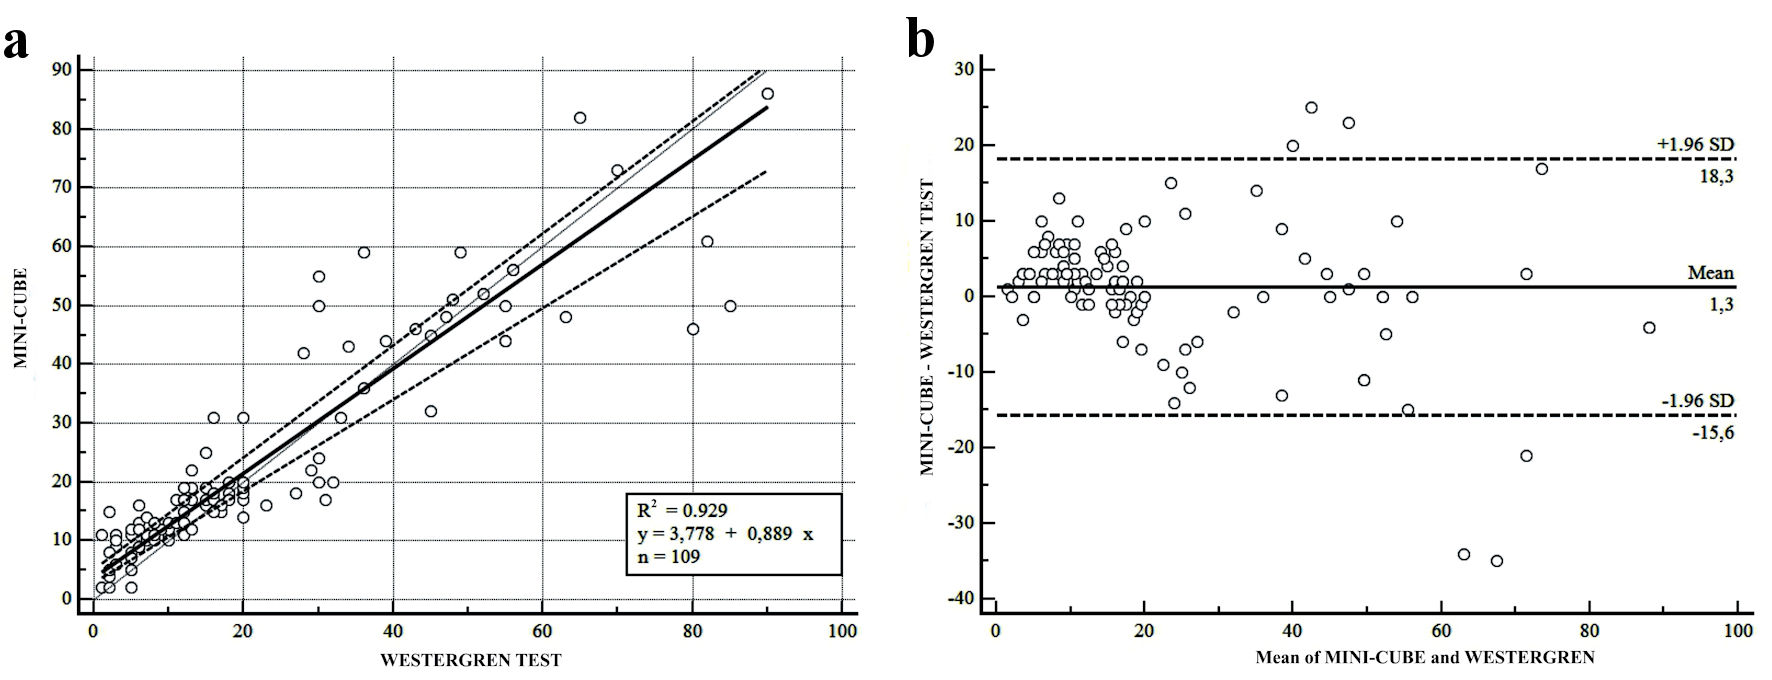
Figure 2. Linear regression and bias plots for the methods comparison for all the samples with normal hematocrit (Hct) (36% - 44%) (n = 109). (a) Passing-Bablok regression analysis between MINI-CUBE vs. Westergren test, defined by the equation y = 3.778 + 0.889x, intercept 3.778 (95% CI: 0.00 - 5.143), slope 0.889 (95% CI: 0.777 - 5.954). It was evaluated R2 of 0.929 (95% CI: 0.898 - 0.951; P < 0.001). (b) Bland-Altman test defined by the Westergren test and MINI-CUBE results (y-axis) and the mean of the two methods. The dotted lines denote the limits of the agreement (max.:18.3; min.: -15.6), and the continued line denotes the bias of 1.3. CI: confidence interval; max.: maximum; min.: minimum; SD: standard deviation.