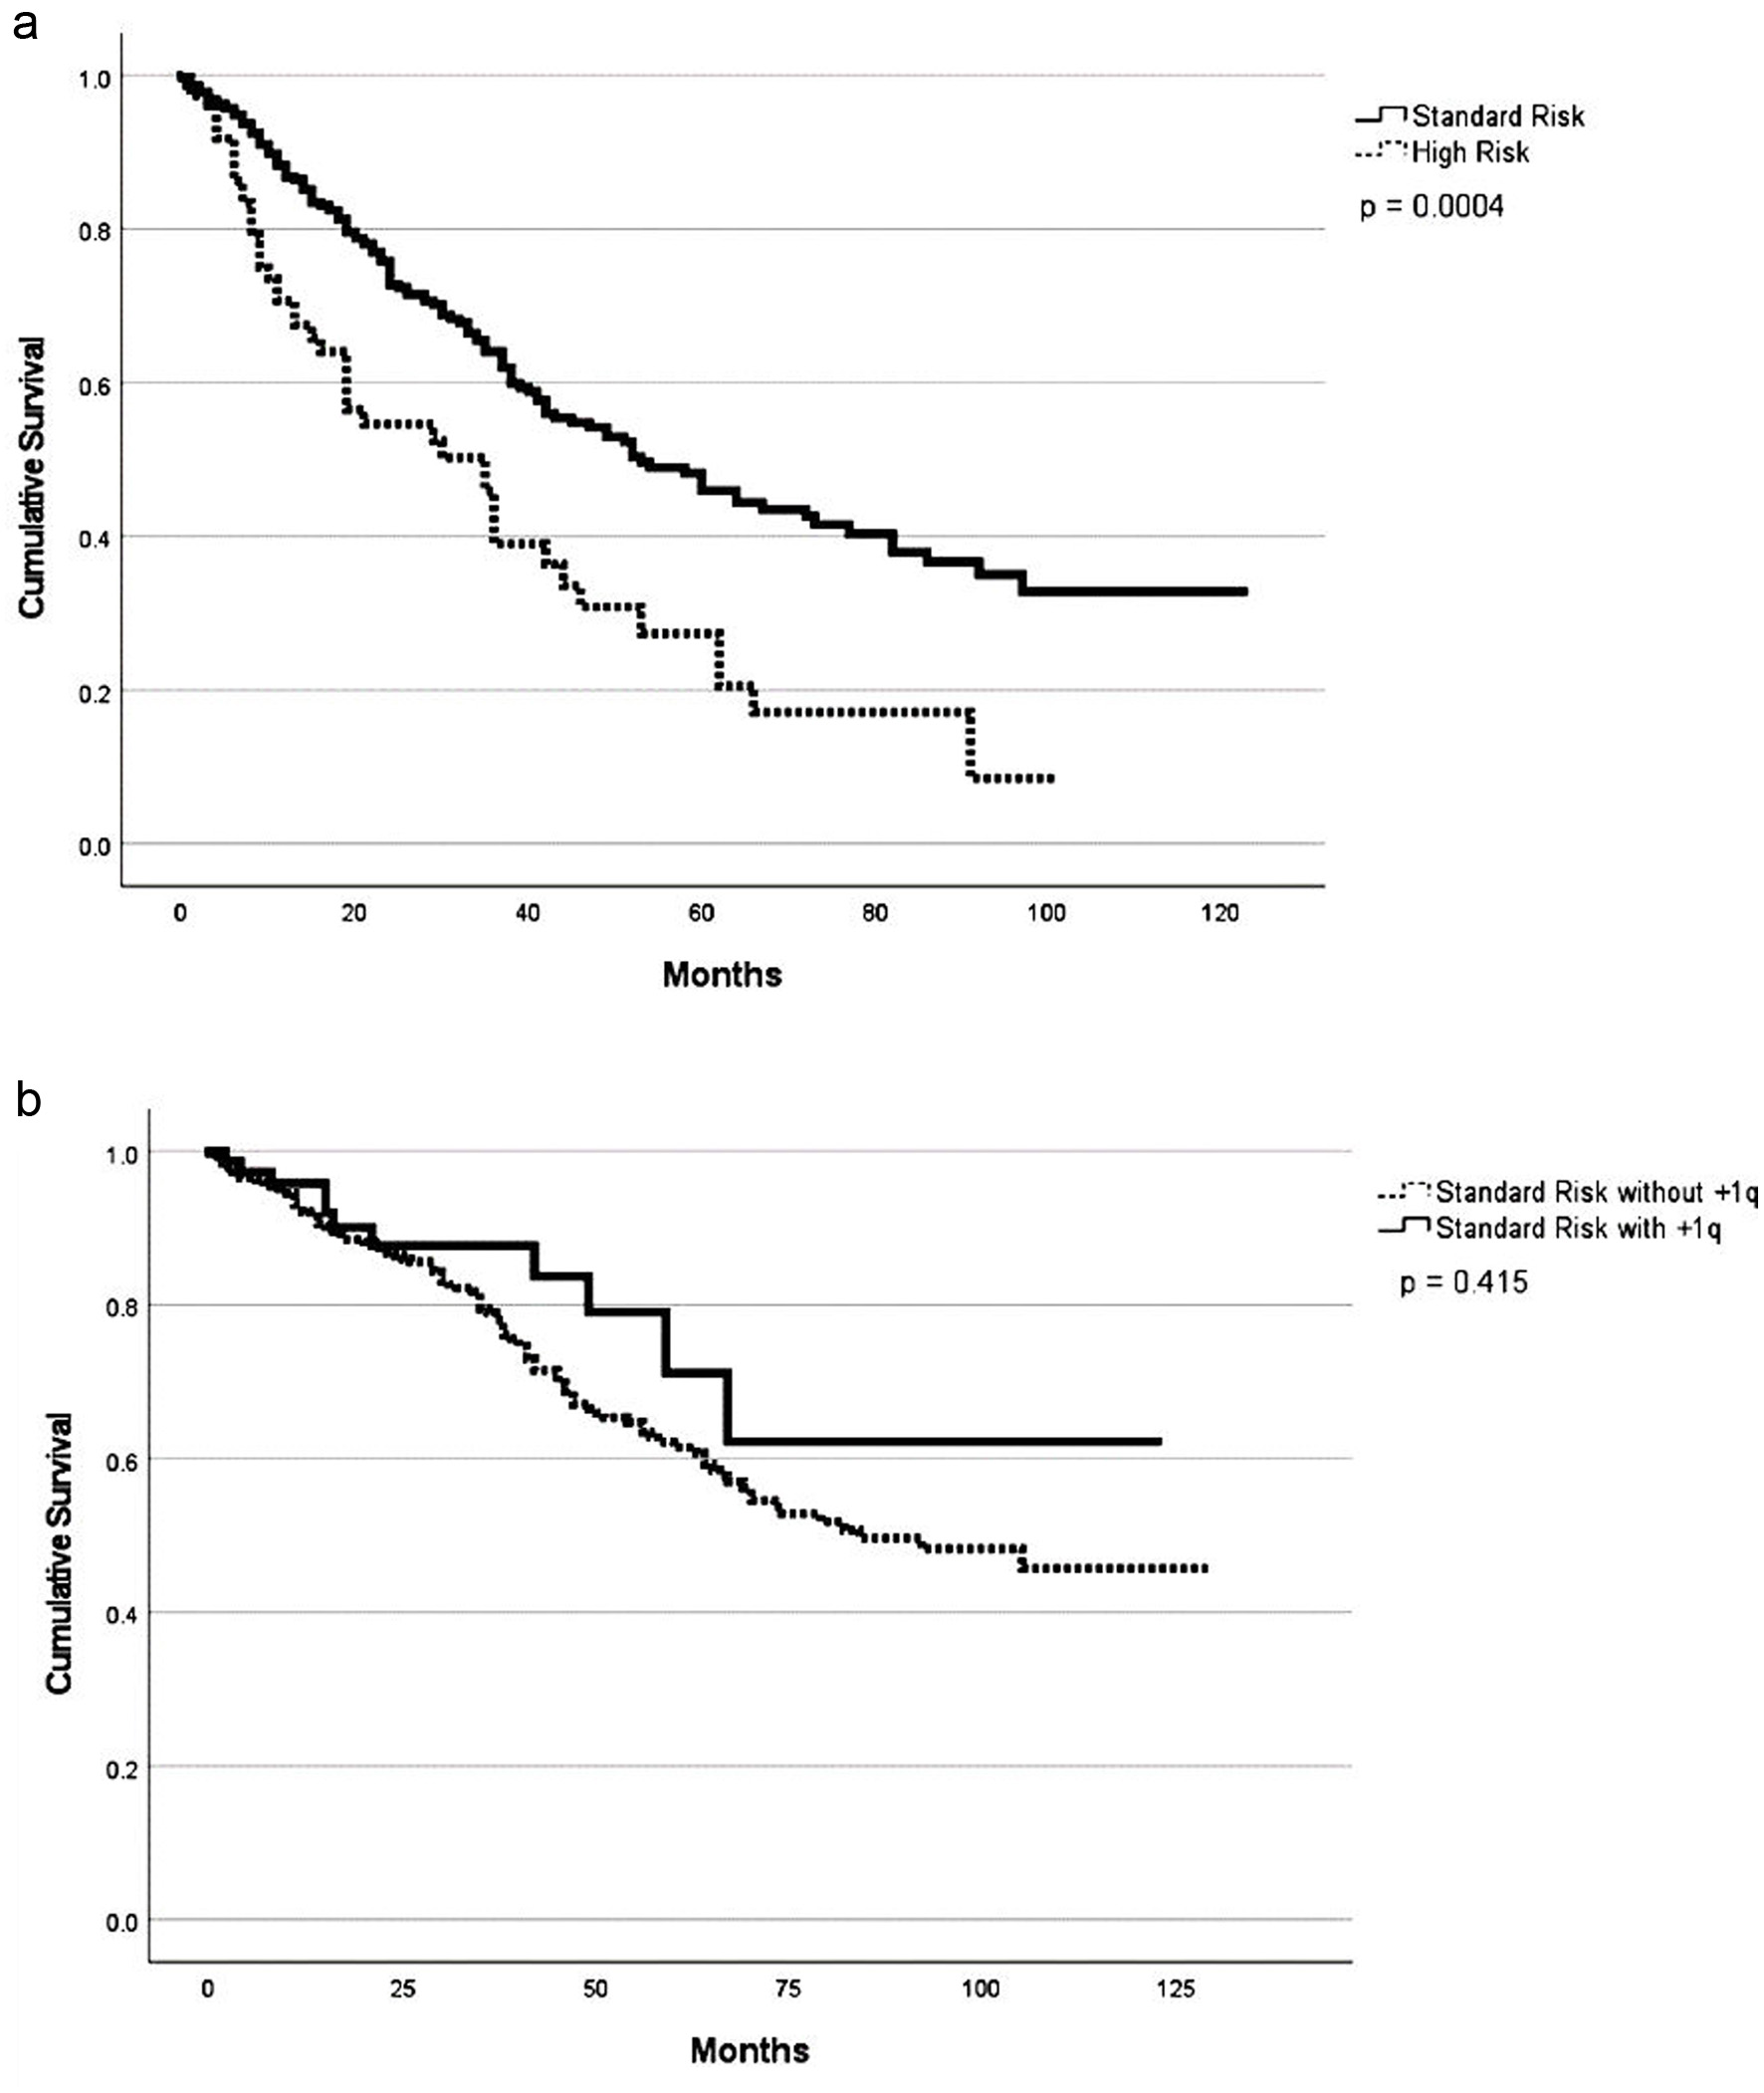
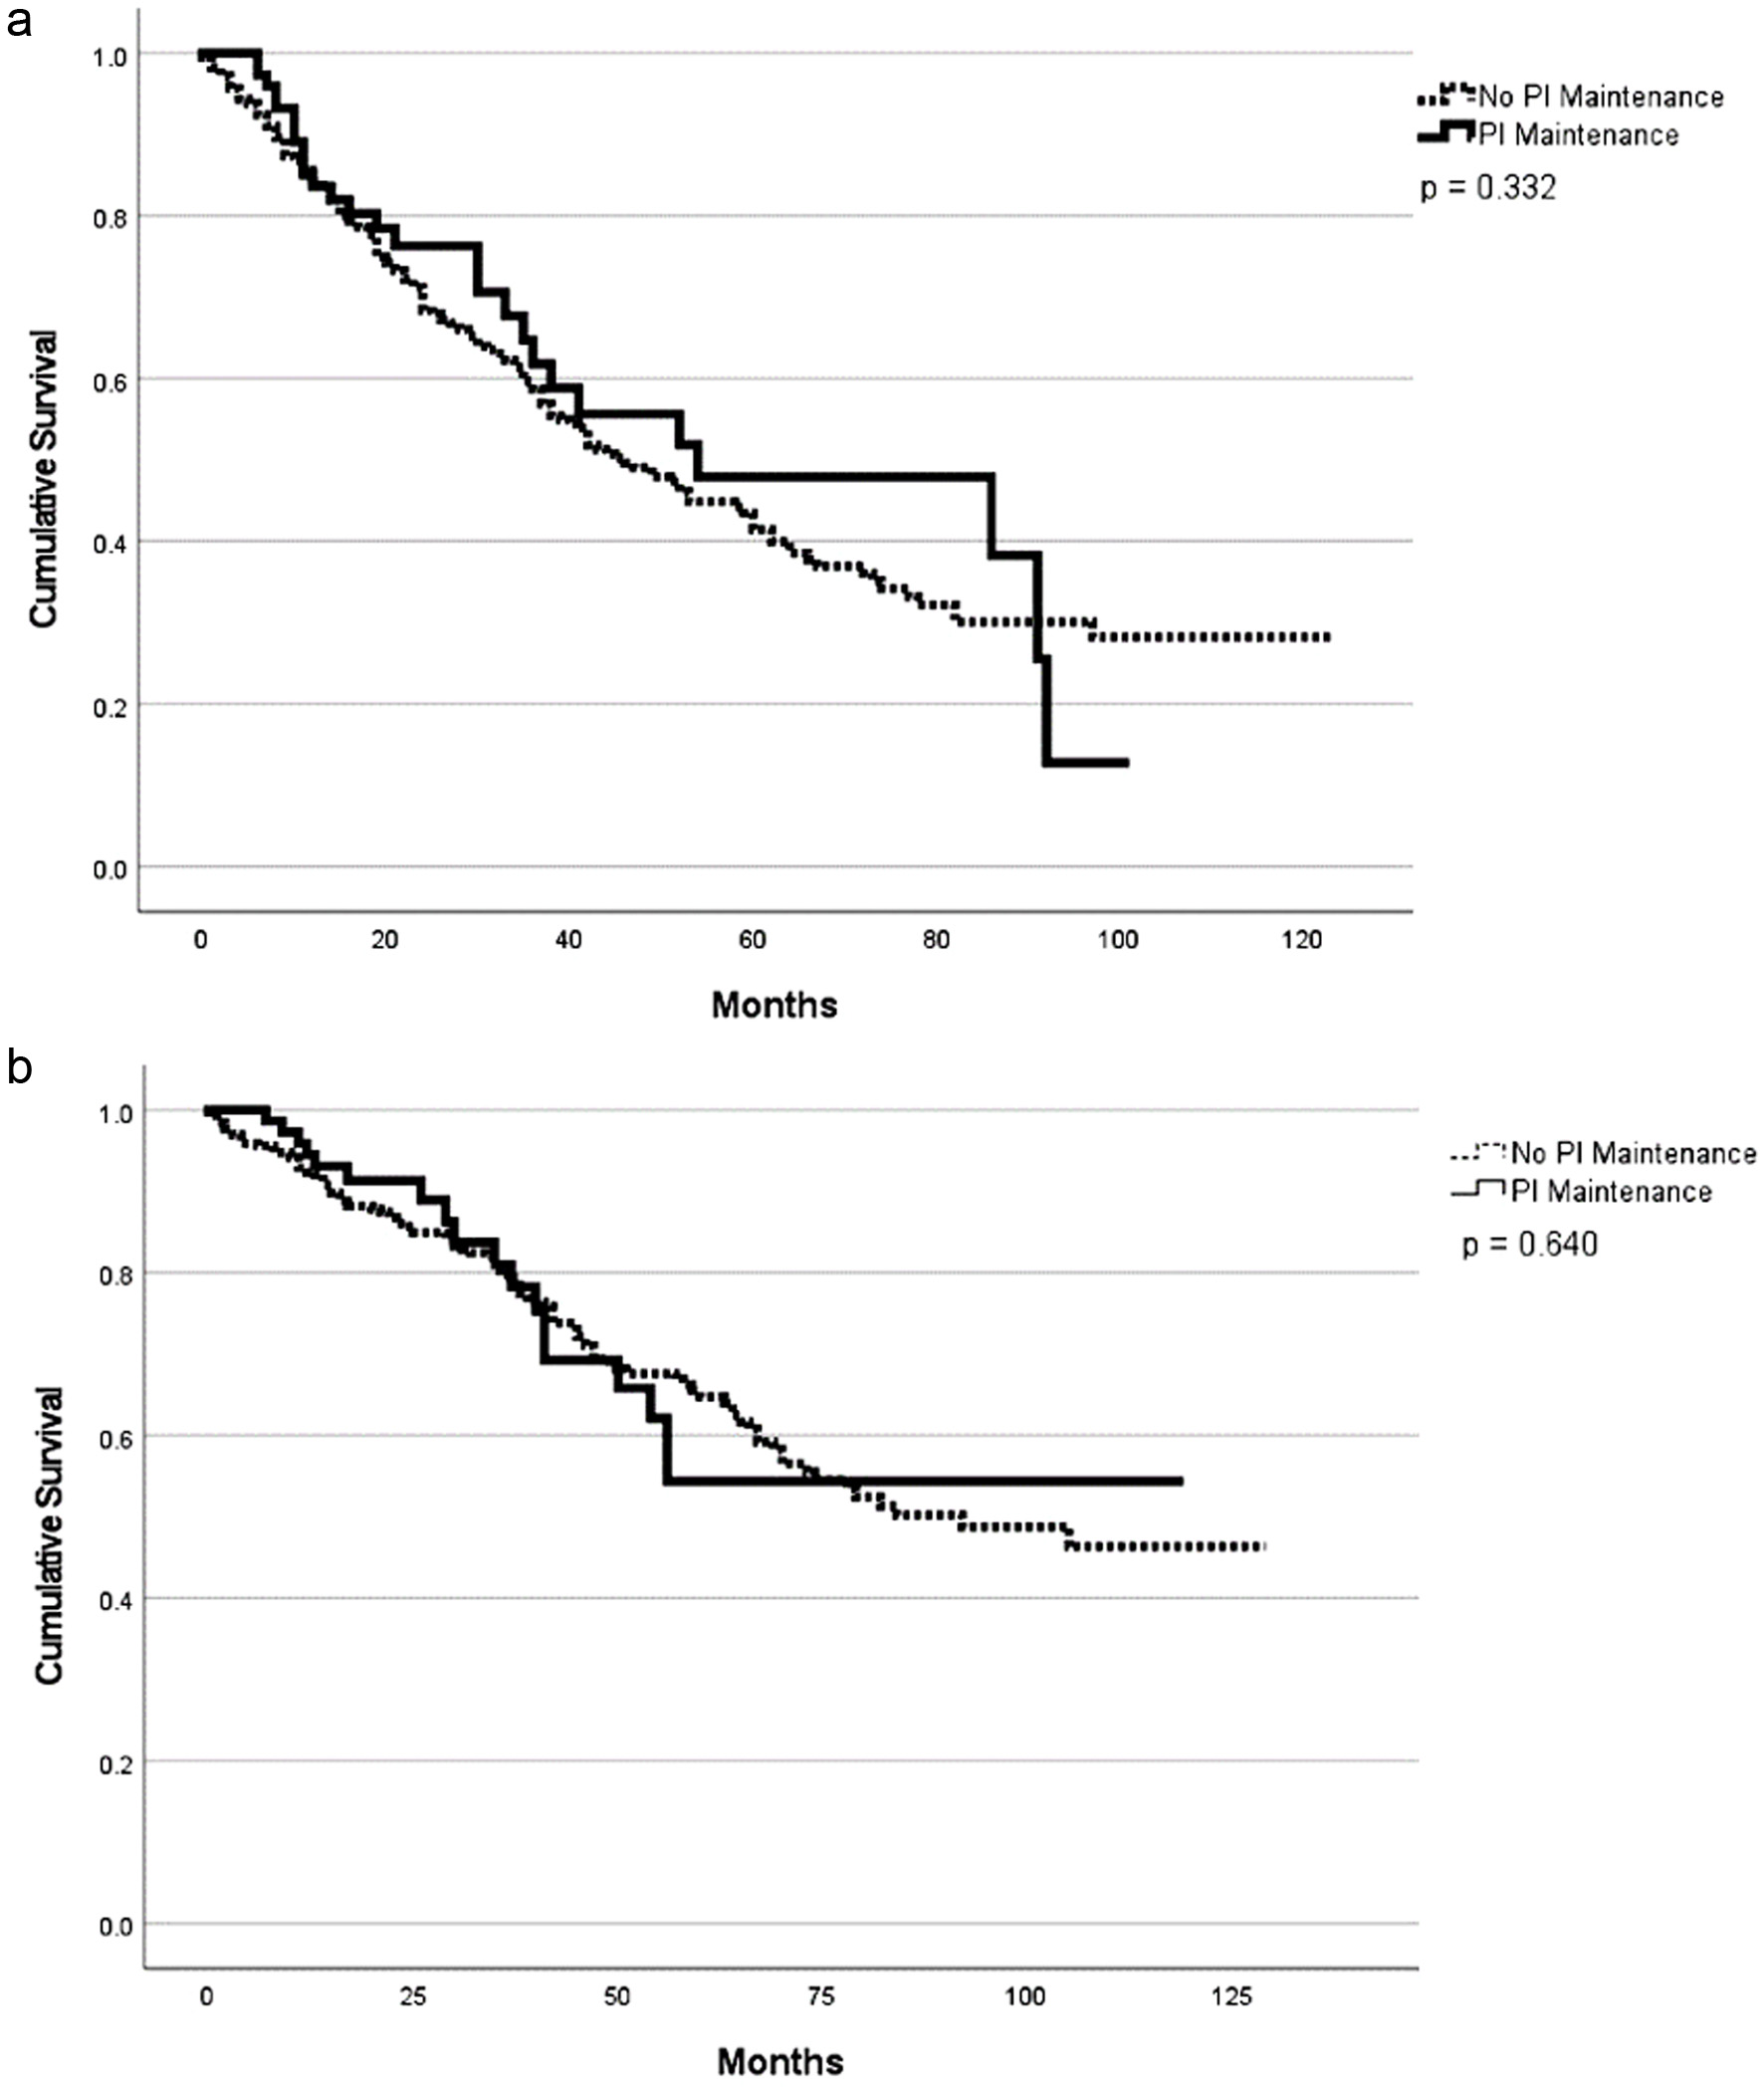
Figure 1. Progression-free survival (a) and overall survival (b) based on cytogenetic profile.
| Journal of Hematology, ISSN 1927-1212 print, 1927-1220 online, Open Access |
| Article copyright, the authors; Journal compilation copyright, J Hematol and Elmer Press Inc |
| Journal website https://www.thejh.org |
Original Article
Volume 12, Number 6, December 2023, pages 243-254
Impact of Cytogenetic Abnormalities, Induction and Maintenance Regimens on Outcomes After High-Dose Chemotherapy and Autologous Stem Cell Transplantation in Patients With Newly Diagnosed Multiple Myeloma: A Decade-Long Real-World Experience
Figures
Tables
| Characteristics | High-risk cytogenetics (N = 73) | Standard-risk cytogenetics (N = 363) | P value |
|---|---|---|---|
| aPercentages may total greater than 100% as patients may have more than one cytogenetic abnormality. bP value for RVd vs. other. cP value is for lenalidomide alone vs. other maintenance regimens. *P < 0.05. RVD: lenalidomide - bortezomib - dexamethasone; Dara-RVD: daratumumab - lenalidomide - bortezomib - dexamethasone; CyBorD: cyclophosphamide - bortezomib - dexamethasone; Ig: immunoglobulin; ECOG: Eastern Cooperative Oncology Group; ISS: International Staging System; HCT-CI: hematopoietic cell transplantation comorbidity index; PI: proteasome inhibitor; sCR/CR: stringent complete response/complete response; VGPR: very good partial response; PR: partial response; SD: stable disease; PD: progressive disease. | |||
| Median age, years (range) | |||
| At diagnosis | 60 (29 - 77) | 60 (21 - 81) | 0.86 |
| At ASCT | 62 (31 - 79) | 62 (25 - 81) | 0.71 |
| Age > 65, n (%) | 17 (23) | 93 (26) | 0.68 |
| Sex, n (%) | |||
| Male | 39 (55) | 203 (56) | 0.70 |
| Female | 34 (45) | 160 (44) | |
| Race/ethnicity, n (%) | |||
| Non-Hispanic White | 46 (61) | 213 (82) | 0.51 |
| Non-Hispanic Black | 27 (36) | 161 (42) | |
| Other | 2 (3) | 6 (2) | |
| Body mass index, n (%) | |||
| < 30 kg/m2 | 40 (55) | 199 (55) | 0.72 |
| ≥ 30 kg/m2 | 33 (45) | 164 (45) | |
| Subtype, n (%) | |||
| IgG | 39 (53) | 230 (63) | |
| IgA | 23 (32) | 63 (18) | 0.05 |
| Light chain only | 9 (12) | 59 (163) | |
| Non-secretory | 2 (3) | 11 (3) | |
| Other | |||
| Durie-Salmon Staging System (DSS), n (%) | |||
| I | 6 (8) | 33 (9) | |
| II | 10 (14) | 63 (17) | |
| III | 30 (41) | 107 (30) | 0.02* |
| Unknown | 27 (37) | 160 (44) | |
| International Staging System (ISS), n (%) | |||
| I | 8 (10) | 104 (29) | |
| II | 18 (25) | 87 (24) | |
| III | 18 (25) | 86 (24) | 0.10 |
| Unknown | 29 (40) | 86 (23) | |
| Revised International Staging System (R-ISS), n (%) | |||
| I | 4 (5) | 52 (14) | |
| II | 12 (16) | 51 (14) | < 0.001* |
| III | 15 (21) | 19 (6) | |
| Unknown | 42 (58) | 241 (66) | |
| ECOG performance status, n (%) | |||
| 0 | 10 (14) | 63 (17) | |
| 1 | 59 (81) | 287 (79) | 0.17 |
| 2+ | 4 (5) | 7 (2) | |
| Missing | 0 | 6 (2) | |
| Cytogenetic abnormalitiesa, n (%) | |||
| Del 17p | 36 (48) | 0 | |
| t4;14 | 34 (45) | 0 | |
| t14;16 | 6 (1) | 0 | < 0.001* |
| t14;20 | 1 (1) | 2 (1) | |
| Amp 1q | 3 (4) | 0 | |
| Gain 1q | 33 (44) | 89 (24) | |
| HCT-CI, n (%) | |||
| 0 - 1 | 17 (35) | 94 (40) | |
| 2 - 3 | 15 (31) | 92 (39) | 0.097 |
| 4+ | 17 (35) | 48 (21) | |
| sCr > 2 or CrCl < 60 mL/min/1.73 m2 at ASCT, n (%) | |||
| Yes | 13 (18) | 53 (14) | |
| No | 44 (60) | 264 (73) | |
| Missing | 16 (22) | 46 (13) | 0.27 |
| Melphalan dose, n (%) | |||
| 200 mg/m2 | 52 (71) | 286 (79) | |
| 140 mg/m2 | 21 (29) | 77 (21) | 0.16 |
| Induction regimen, n (%)b | |||
| RVd | 29 (39) | 207 (57) | |
| Dara-RVd | 6 (8) | 26 (7) | |
| CyBordD | 1 (3) | 76 (21) | 0.01* |
| Carfilzomib-based | 9 (11) | 23 (6) | |
| Other | 28 (39) | 31 (9) | |
| Maintenance regimen, n (%)c | |||
| Lenalidomide | 37 (51) | 264 (72) | |
| Lenalidomide + PI | 19 (26) | 26 (7) | |
| Lenalidomide + daratumumab | 4 (5) | 13 (4) | < 0.001* |
| PI only | 2 (4) | 13 (4) | |
| Other | 4 (5) | 4 (1) | |
| None | 7 (9) | 43 (12) | |
| Best overall response post ASCT, n (%) | |||
| sCR/CR | 33 (45) | 161 (44) | |
| VGPR | 29 (39) | 140 (38) | |
| PR | 4 (5) | 47 (13) | 0.01* |
| SD | 4 (5) | 3 (1) | |
| PD | 3 (5) | 4 (1) | |
| Response prior to ASCT, n (%) | |||
| sCR/CR | 11 (15) | 61 (17) | |
| VGPR | 27 (37) | 155 (44) | |
| PR | 32 (44) | 135 (37) | 0.34 |
| SD | 3 (4) | 5 (1) | |
| PD | 0 (0) | 4 (1) | |
| Response at day +100 post ASCT, n (%) | |||
| sCR/CR | 29 (40) | 115 (32) | |
| VGPR | 34 (47) | 161 (44) | |
| PR | 3 (4) | 59 (16) | |
| SD | 1 (1) | 3 (1) | 0.09 |
| PD | 2 (3) | 7 (7) | |
| Response at 2-years post ASCT, n (%) | |||
| sCR/CR | 14 (19) | 82 (23) | |
| VGPR | 9 (12) | 61 (17) | |
| PR | 1 (1) | 21 (6) | 0.16 |
| SD | 2 (3) | 11 (3) | |
| PD | 15 (21) | 45 (12) | |
| PFS, median months (range) | P value | OS, median months (range) | P value | Best ORR, % | P value | Overall VGPR, % | P value | |
|---|---|---|---|---|---|---|---|---|
| Cytogenetics | ||||||||
| High-risk | 29 (1 - 100) | < 0.001* | 70 (1 - 101) | 0.13 | 90 | 0.01 | 85 | 0.67 |
| Standard-risk | 58 (1 - 123) | NR (1 - 128) | 96 | 83 | ||||
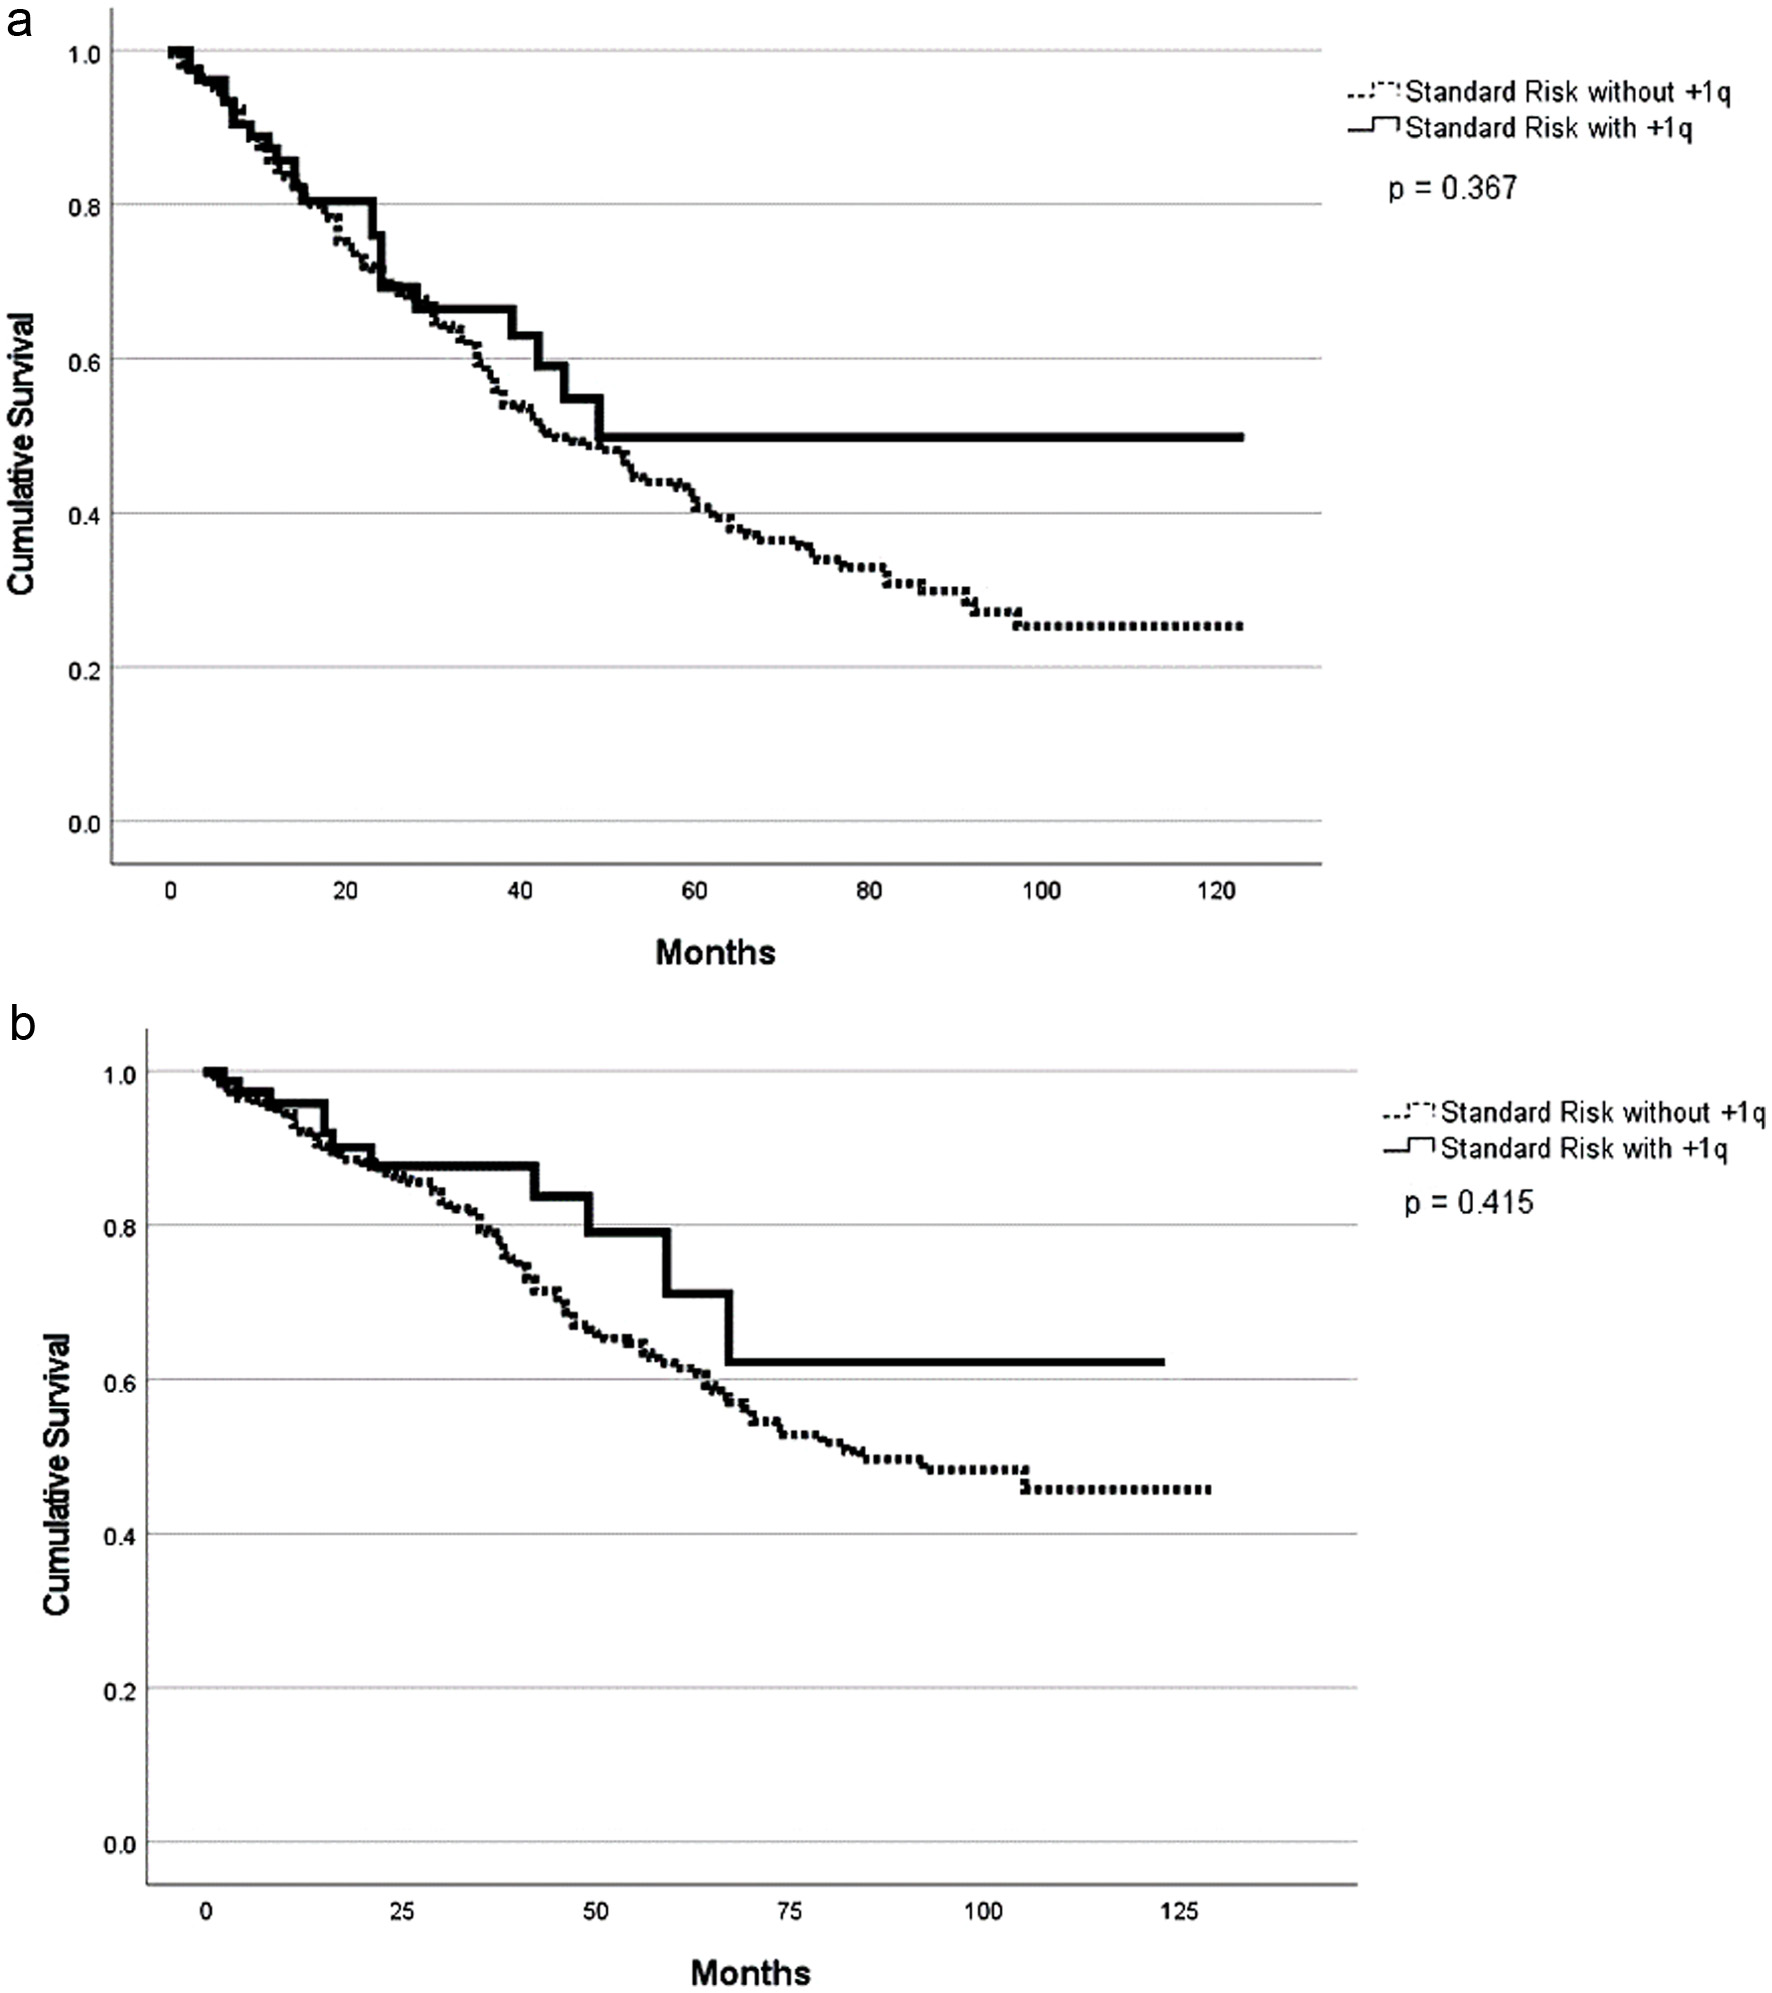
| Standard-risk | ||||||||
| With +1q | 38 (1 - 123) | 0.01* | 60 (1 - 123) | 0.01* | 98 | 0.64 | 82 | 0.84 |
| Without +1q | 76(1 - 122) | NR (1 - 128) | 96 | 83 | ||||
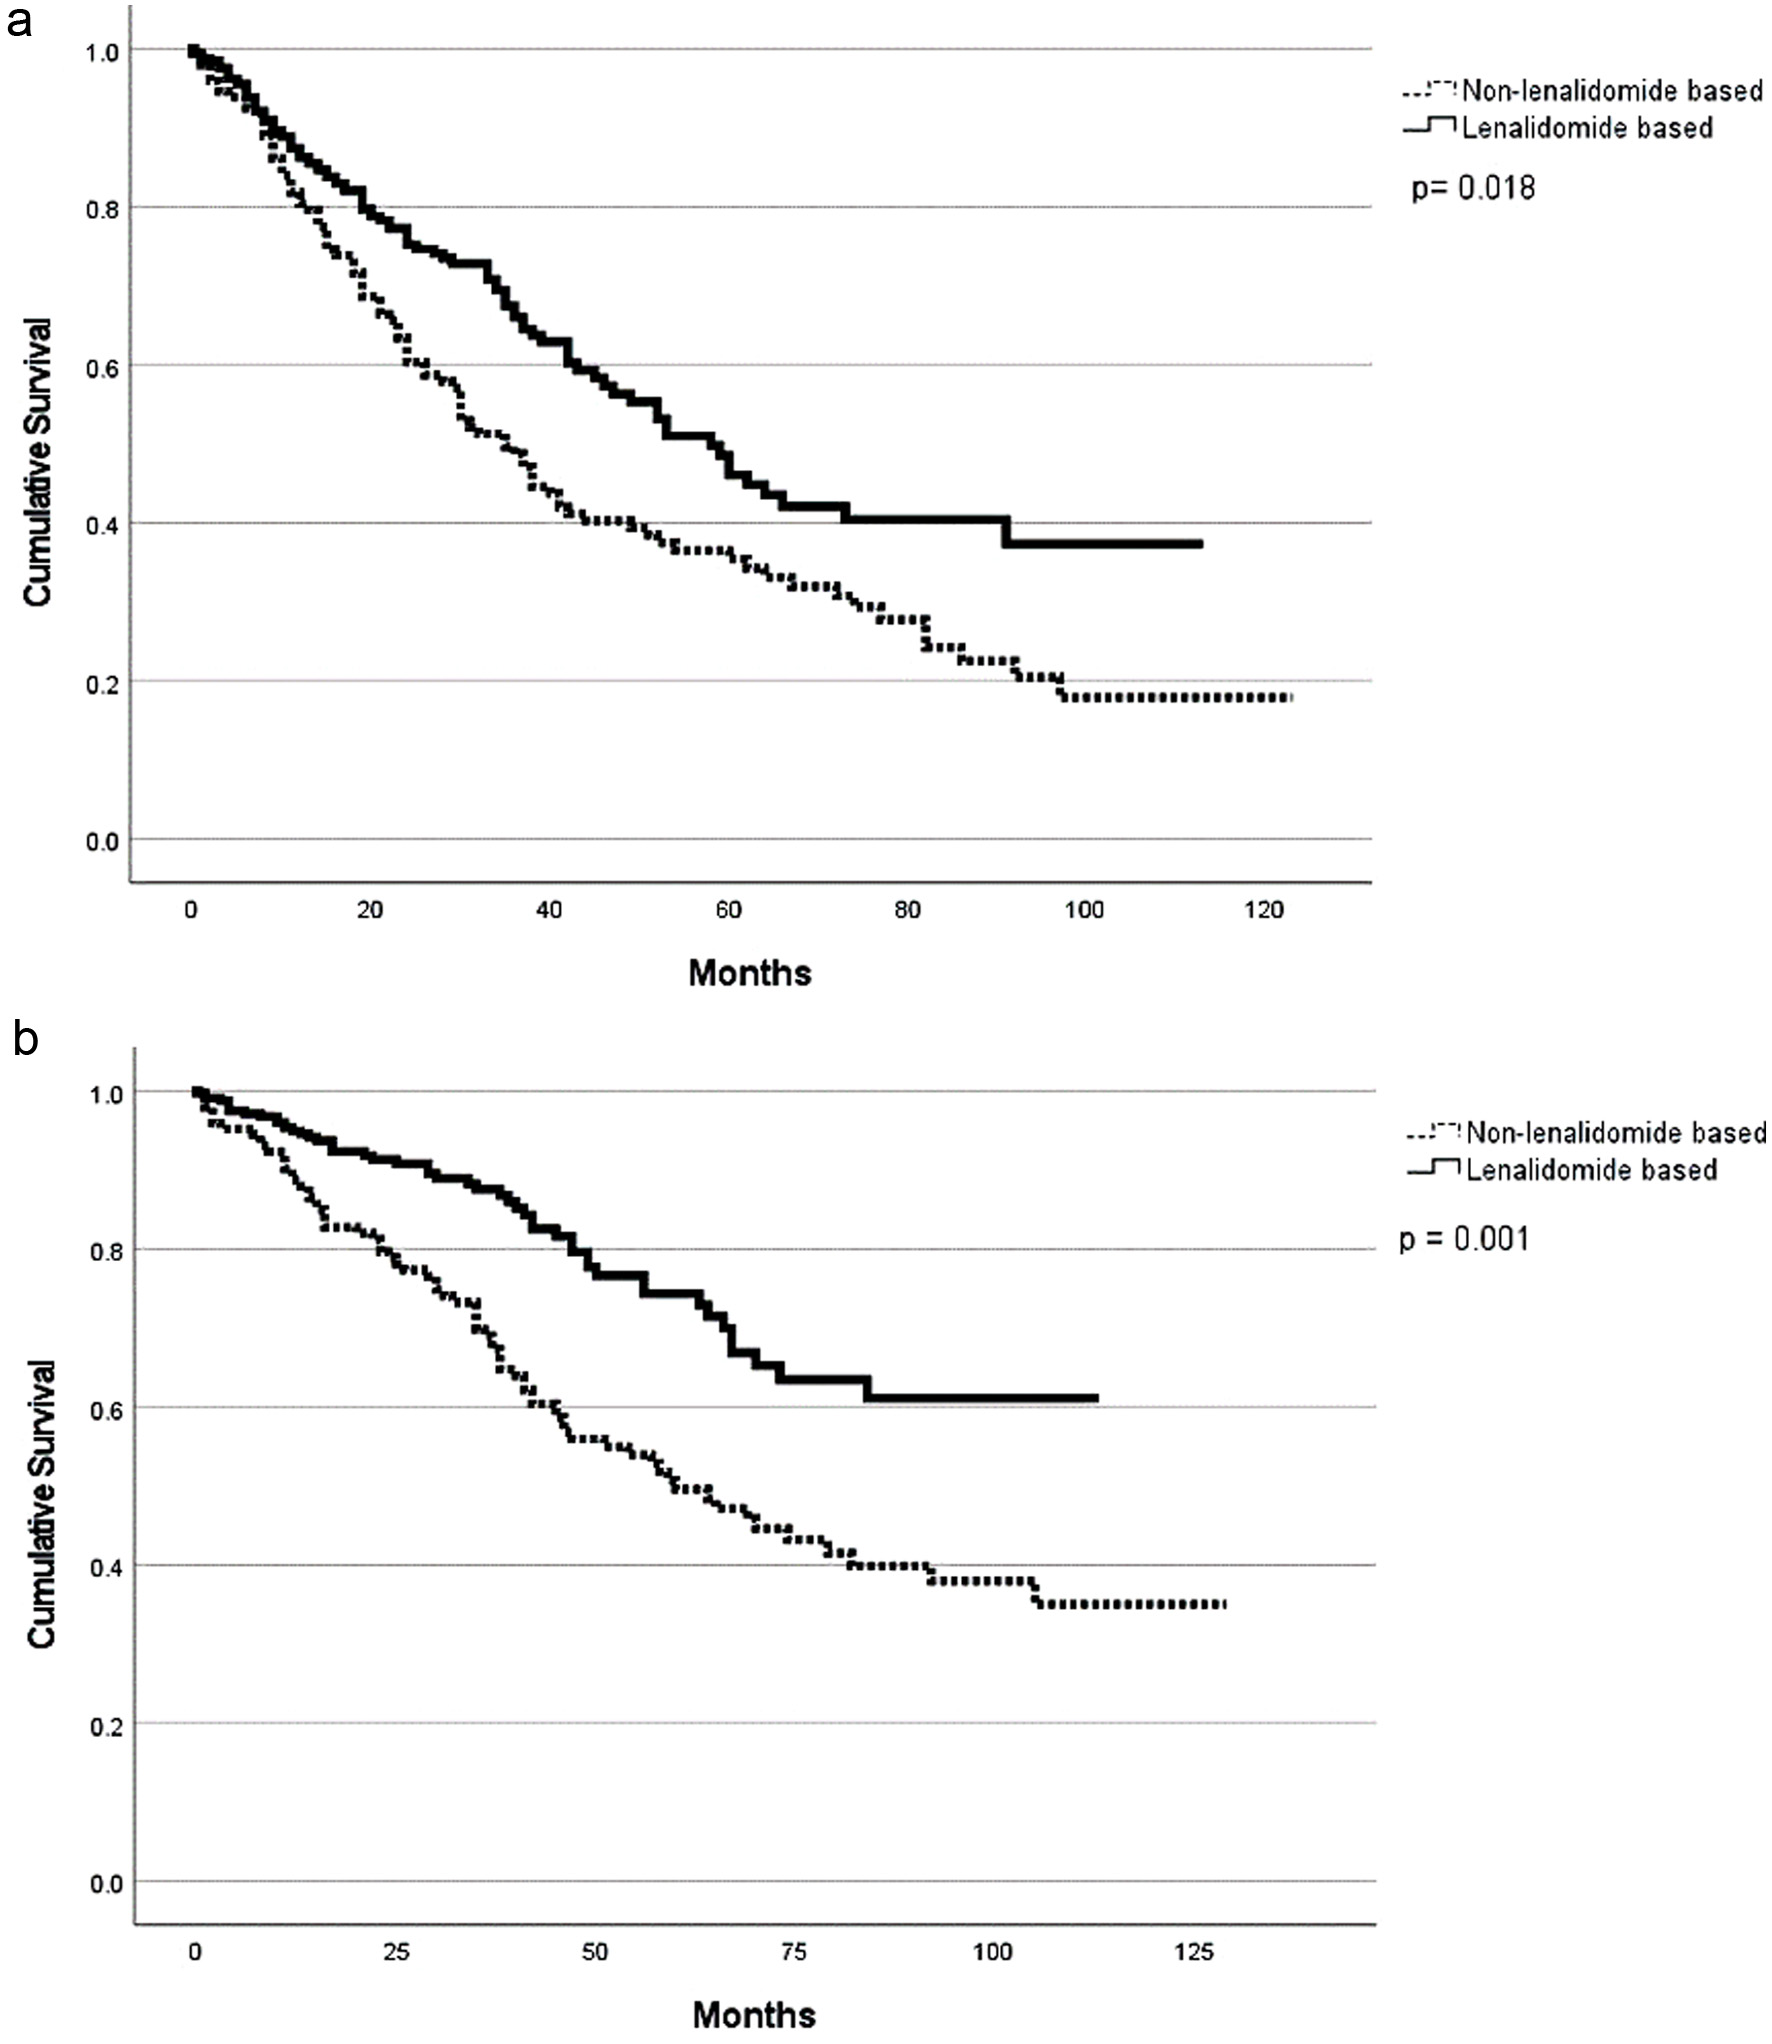
| Induction regimen | ||||||||
| Lenalidomide-based | 53 (1 - 112) | 0.05* | NR (1 - 112) | 0.02* | 96 | 0.41 | 84 | 0.09 |
| Non-lenalidomide-based | 39 (1 - 123) | 78(1 - 123) | 94 | 83 | ||||
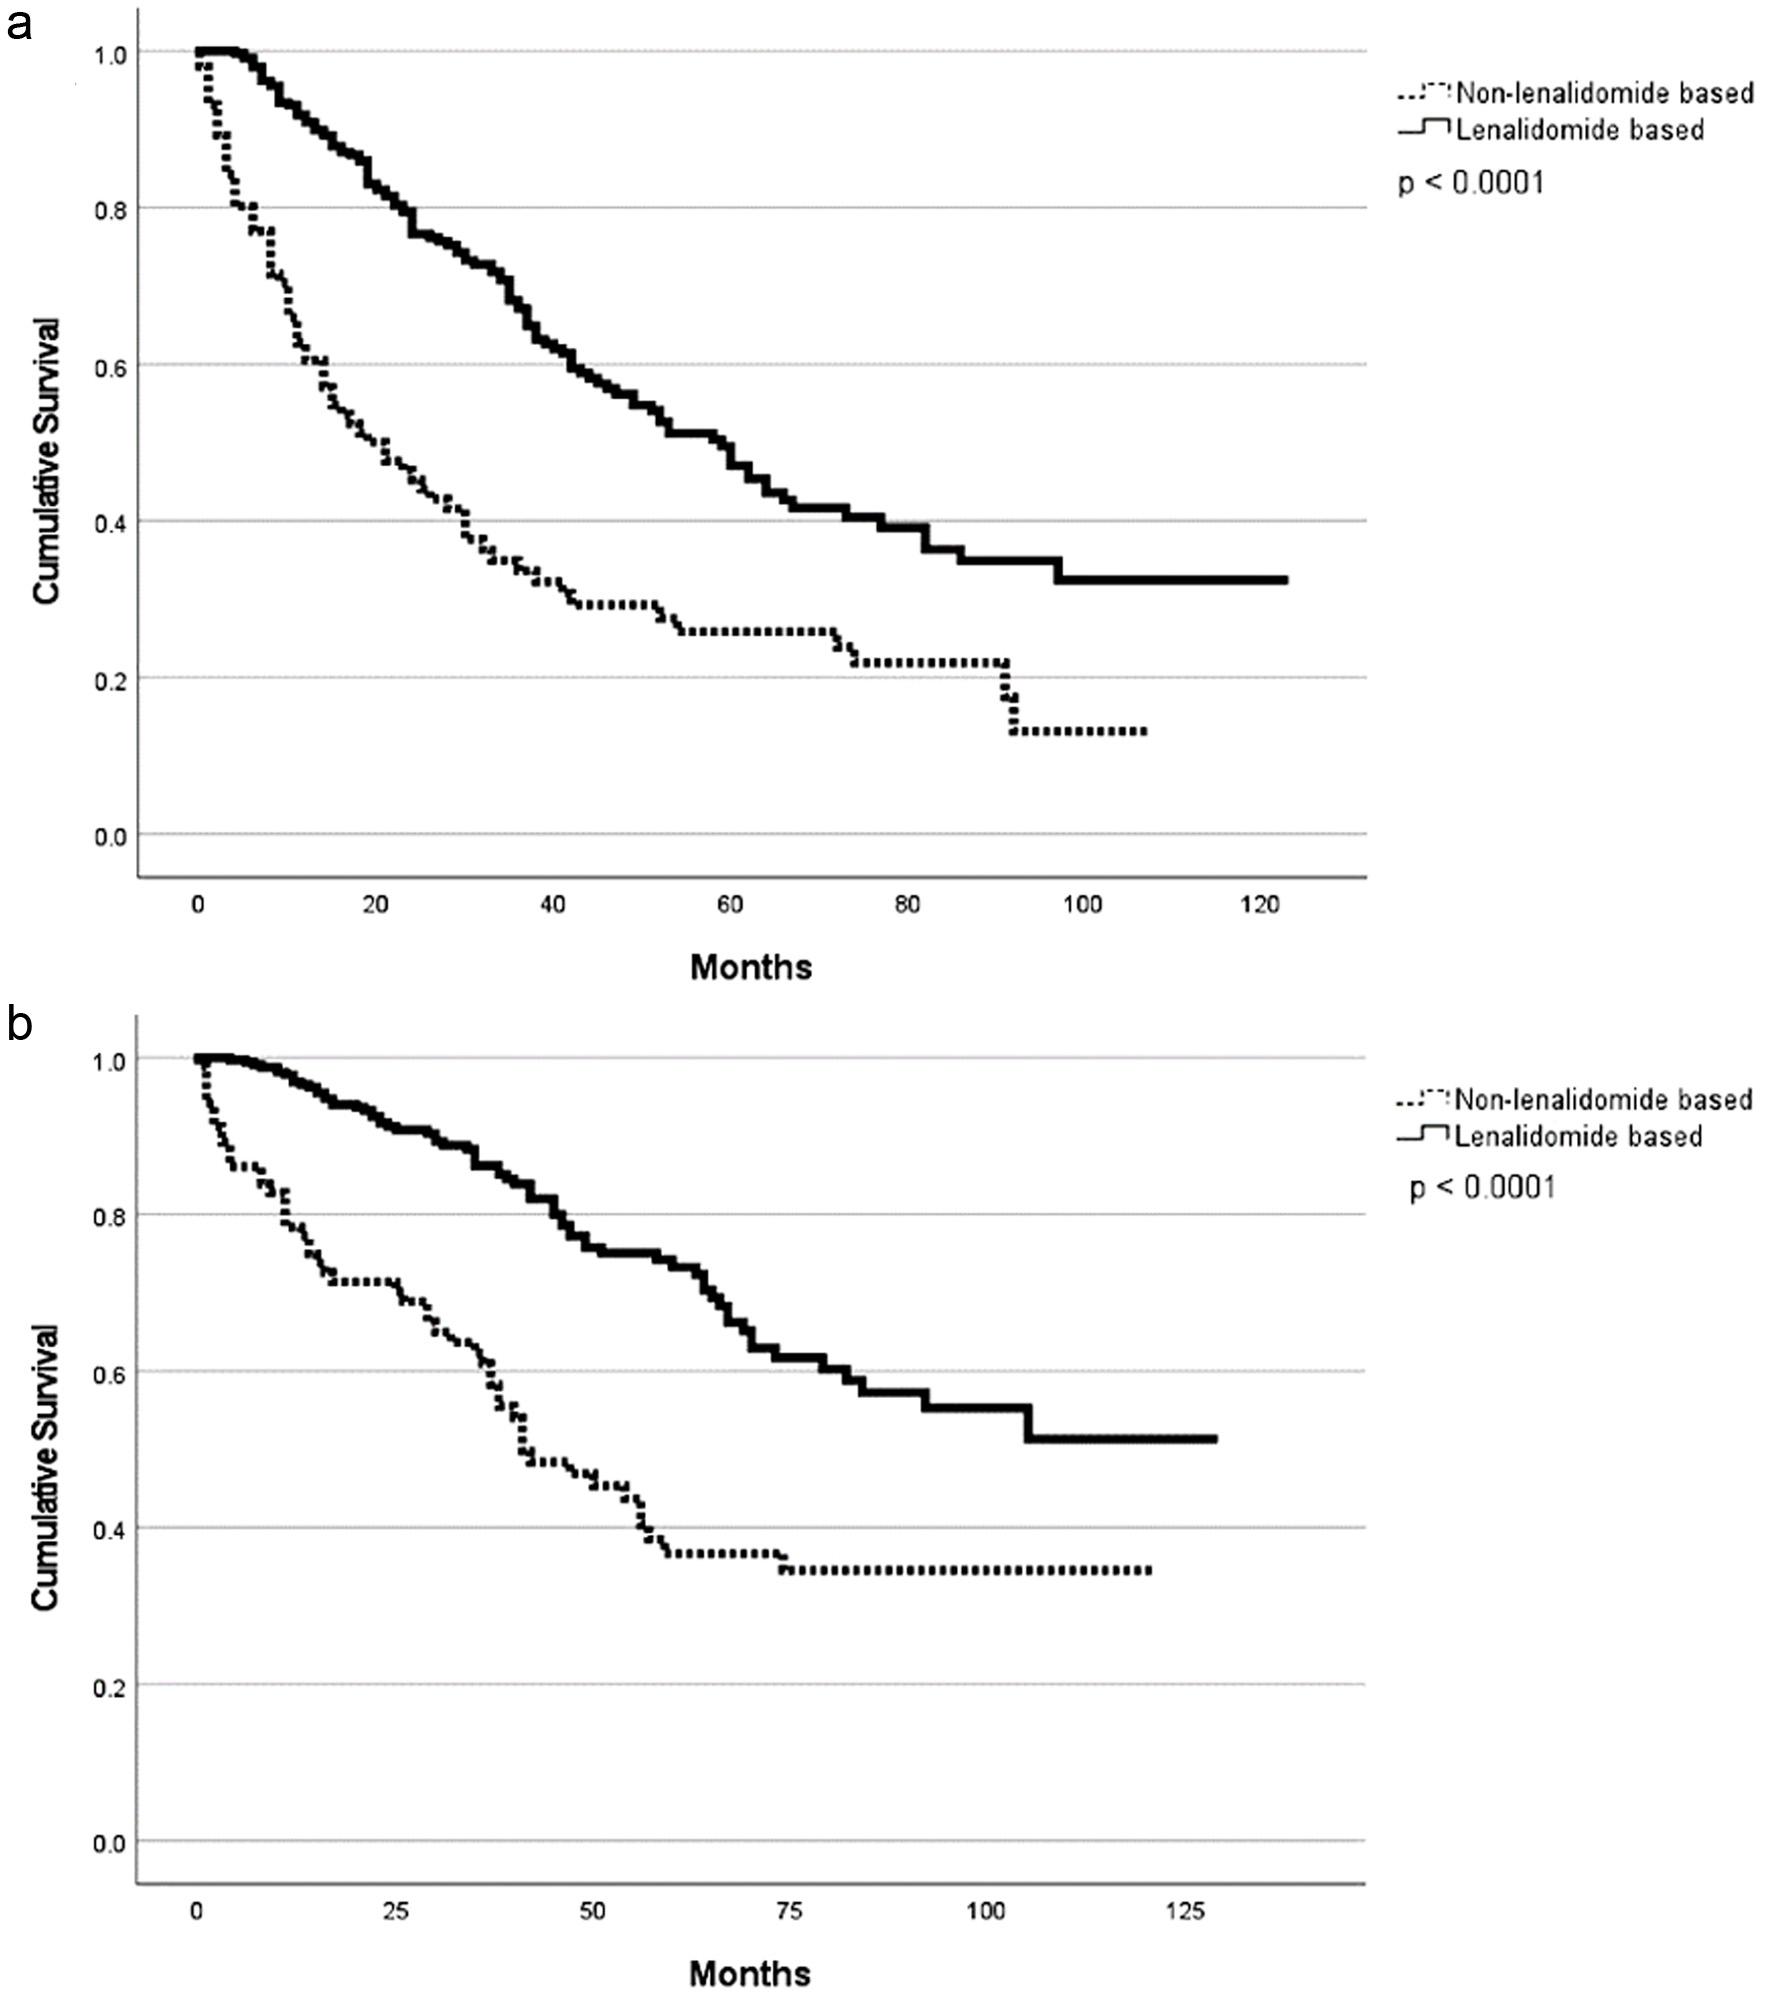
| Maintenance regimen | ||||||||
| Lenalidomide-based | 53 (1 - 123) | 0.003* | 104 | 0.02* | 98 | < 0.001* | 87 | 0.16 |
| Non-lenalidomide-based | 38 (2 - 91) | NR | 91 | 86 | ||||
| Maintenance regimen | ||||||||
| PI-based | 54 (11 - 97) | 0.43 | NR | 0.82 | 94 | 0.23 | 86 | 0.054 |
| Non-PI-based | 46 (37 - 55) | 92 (NR) | 89 | 76 |
| Univariate analysis | PFS HR (95% CI) | OS HR (95% CI) |
|---|---|---|
| ISS: International Staging System; PFS: progression-free survival; OS: overall survival; HCT-CI: hematopoietic cell transplantation specific comorbidity index; HR: hazard ratio; CI: confidence interval. | ||
| Cytogenetic risk profile: high-risk | 2.085 (1.483 - 2.931) | 1.421 (0.897 - 2.252) |
| Presence of +1q abnormality | 0.761 (0.417 - 1.387) | 1.250 (0.618 - 2.532) |
| ISS II/III | 1.183 (0.881 - 1.588) | 1.197 (0.821 - 1.743) |
| Lenalidomide-based induction | 0.740 (0.550 - 0.996) | 0.628 (0.430 - 0.919) |
| Melphalan 200 mg/m2 | 0.797 (0.566 - 1.123) | 0.786 (0.512 - 1.207) |
| Proteasome inhibitor-based maintenance | 0.852 (0.572 - 1.271) | 0.942 (0.571 - 1.554) |
| Lenalidomide-based maintenance | 0.426 (0.318 - 0.570) | 0.376 (0.263 - 0.538) |
| Age > 65 | 1.068 (0.801 - 1.423) | 1.064 (0.738 - 1.535) |
| Race/ethnicity: White vs. African American | 0.955 (0.718 - 1.269) | 1.018 (0.711 - 1.456) |
| HCT-CI 3+ | 0.823 (0.478 - 1.416) | 1.053 (0.481 - 2.306) |
| Multivariate analysis | PFS HR (95% CI) | OS HR (95% CI) |
|---|---|---|
| ISS: International Staging System; PFS: progression-free survival; OS: overall survival; HCT-CI: hematopoietic cell transplantation specific comorbidity index; HR: hazard ratio; CI: confidence interval. | ||
| Cytogenetic risk profile: high-risk | 0.285 (0.142 - 0.572) | 0.699 (0.218 - 2.236) |
| Presence of +1q abnormality | 1.682 (0.922 - 3.068) | 1.916 (0.752 - 4.881) |
| ISS II/III | 1.628 (0.854 - 3.102) | 1.266 (0.467 - 3.433) |
| Lenalidomide-based induction | 1.502 (0.681 - 3.310) | 1.447 (0.427 - 4.910) |
| Melphalan 200 mg/m2 | 1.110 (0.493 - 2.500) | 1.727 (0.464 - 6.428) |
| Proteasome inhibitor-based maintenance | 0.191 (0.072 - 0.508) | 0.306 (0.077 - 1.209) |
| Lenalidomide-based maintenance | 0.267 (0.118 - 0.606) | 0.158 (0.054 - 0.458) |
| Age > 65 | 2.280 (1.162 - 4.474) | 1.848 (0.642 - 5.317) |
| Race/ethnicity: White vs. African American | 0.815 (0.434 - 1.531) | 1.123 (0.424 - 2.973) |
| HCT-CI 3+ | 0.653 (0.301 - 1.416) | 1.169 (0.391 - 3.492) |