Figures
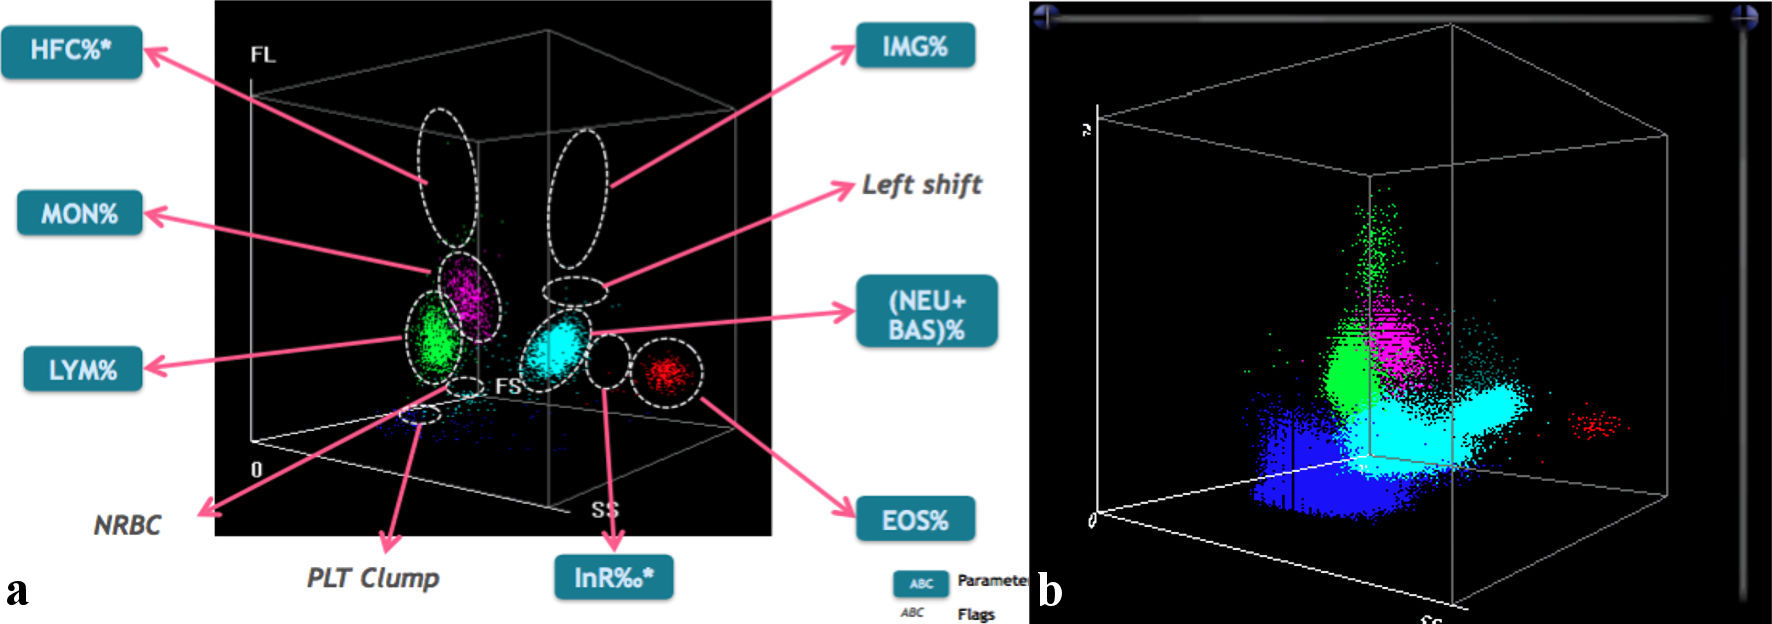
Figure 1. (a) In the left image, the typical scattergram showing the distribution of different white blood cell populations in three-dimensional space (by MINDRAY BC 6800). (b) In the right image, the patient graph shows clear lymphocytosis (green population). The presence of high-fluorescent cells (HFCs) is indicative of the probable presence of blasts or atypical lymphocytes. In addition, there is a nonhomogeneous cloud of nucleated red blood cells (NRBCs), light blue color) located between the population of lymphocytes (LYM) and neutrophils (NEU). At the bottom, blue in color, is the expanded cloud of platelets (PLT), an obvious sign of thrombocytosis. EOS: eosinophils; MON: monocytes; BAS: basophils.
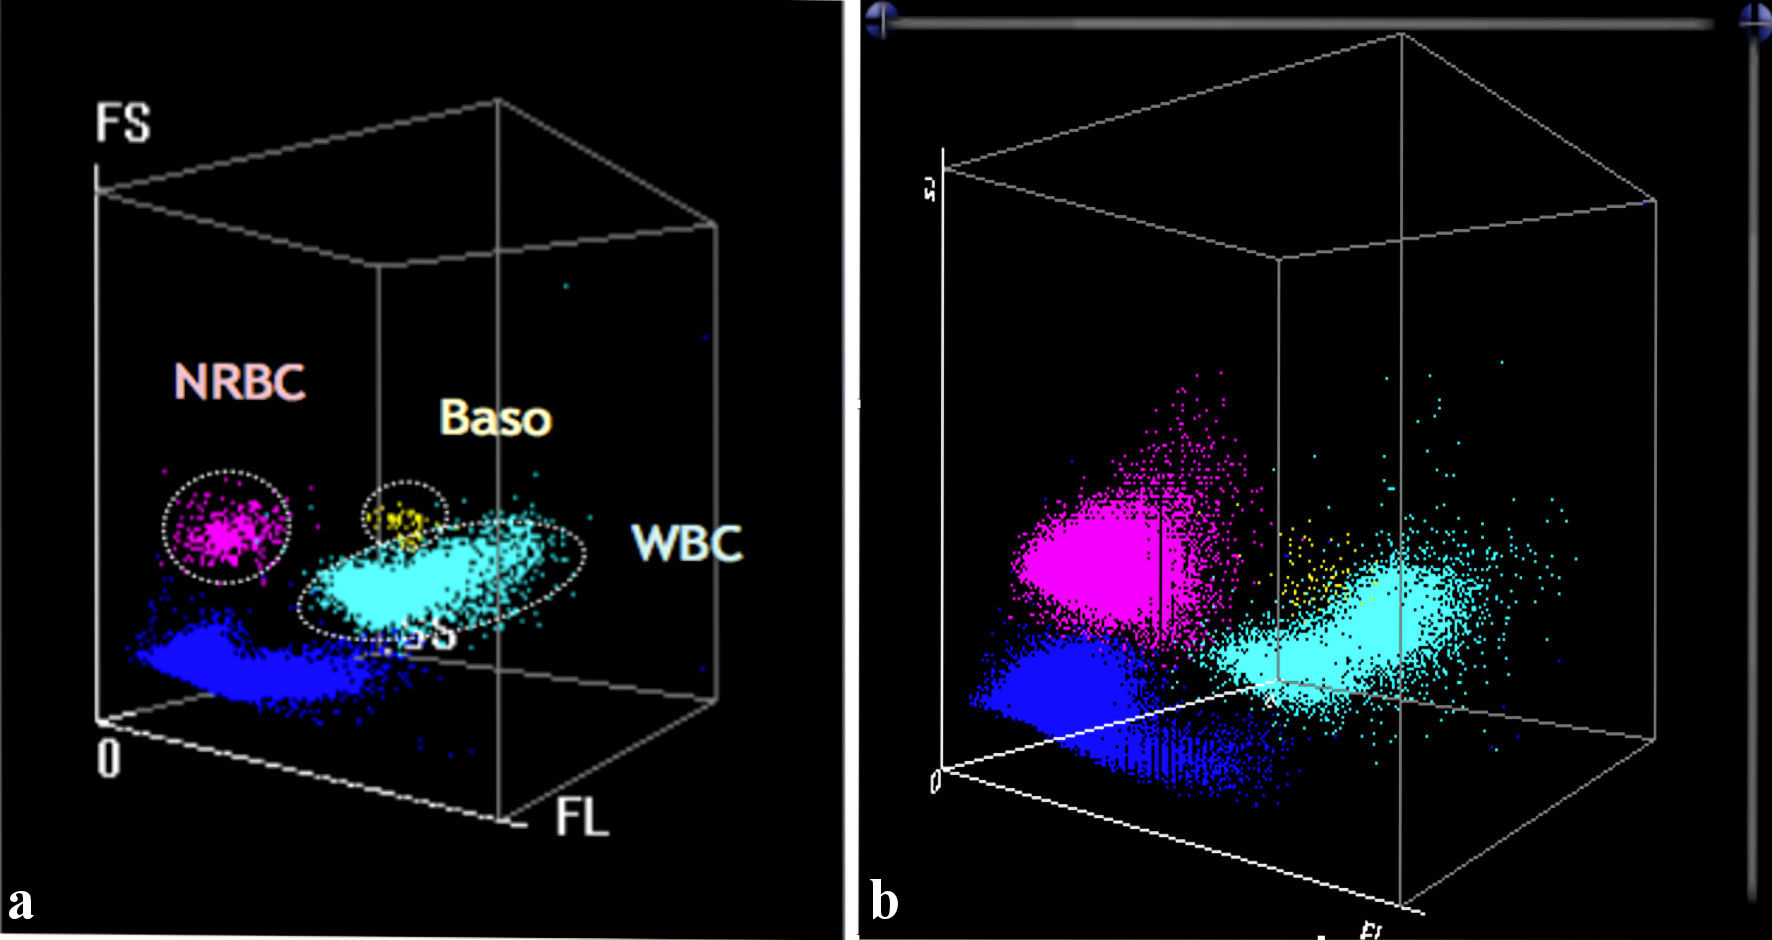
Figure 2. (a) In the left image, the WNB channel (MINDRAY BC 6800) is represented, which is dedicated exclusively to NRBCs (purple), basophils (Baso) (yellow) and neutrophils (light blue). (b) The patient graph (right) confirms the presence of a discrete population of NRBCs compared with the reference graphical pattern (left). WNB: white cell nucleated basophil channel; NRBCs: nucleated red blood cells; WBC: white blood cell.
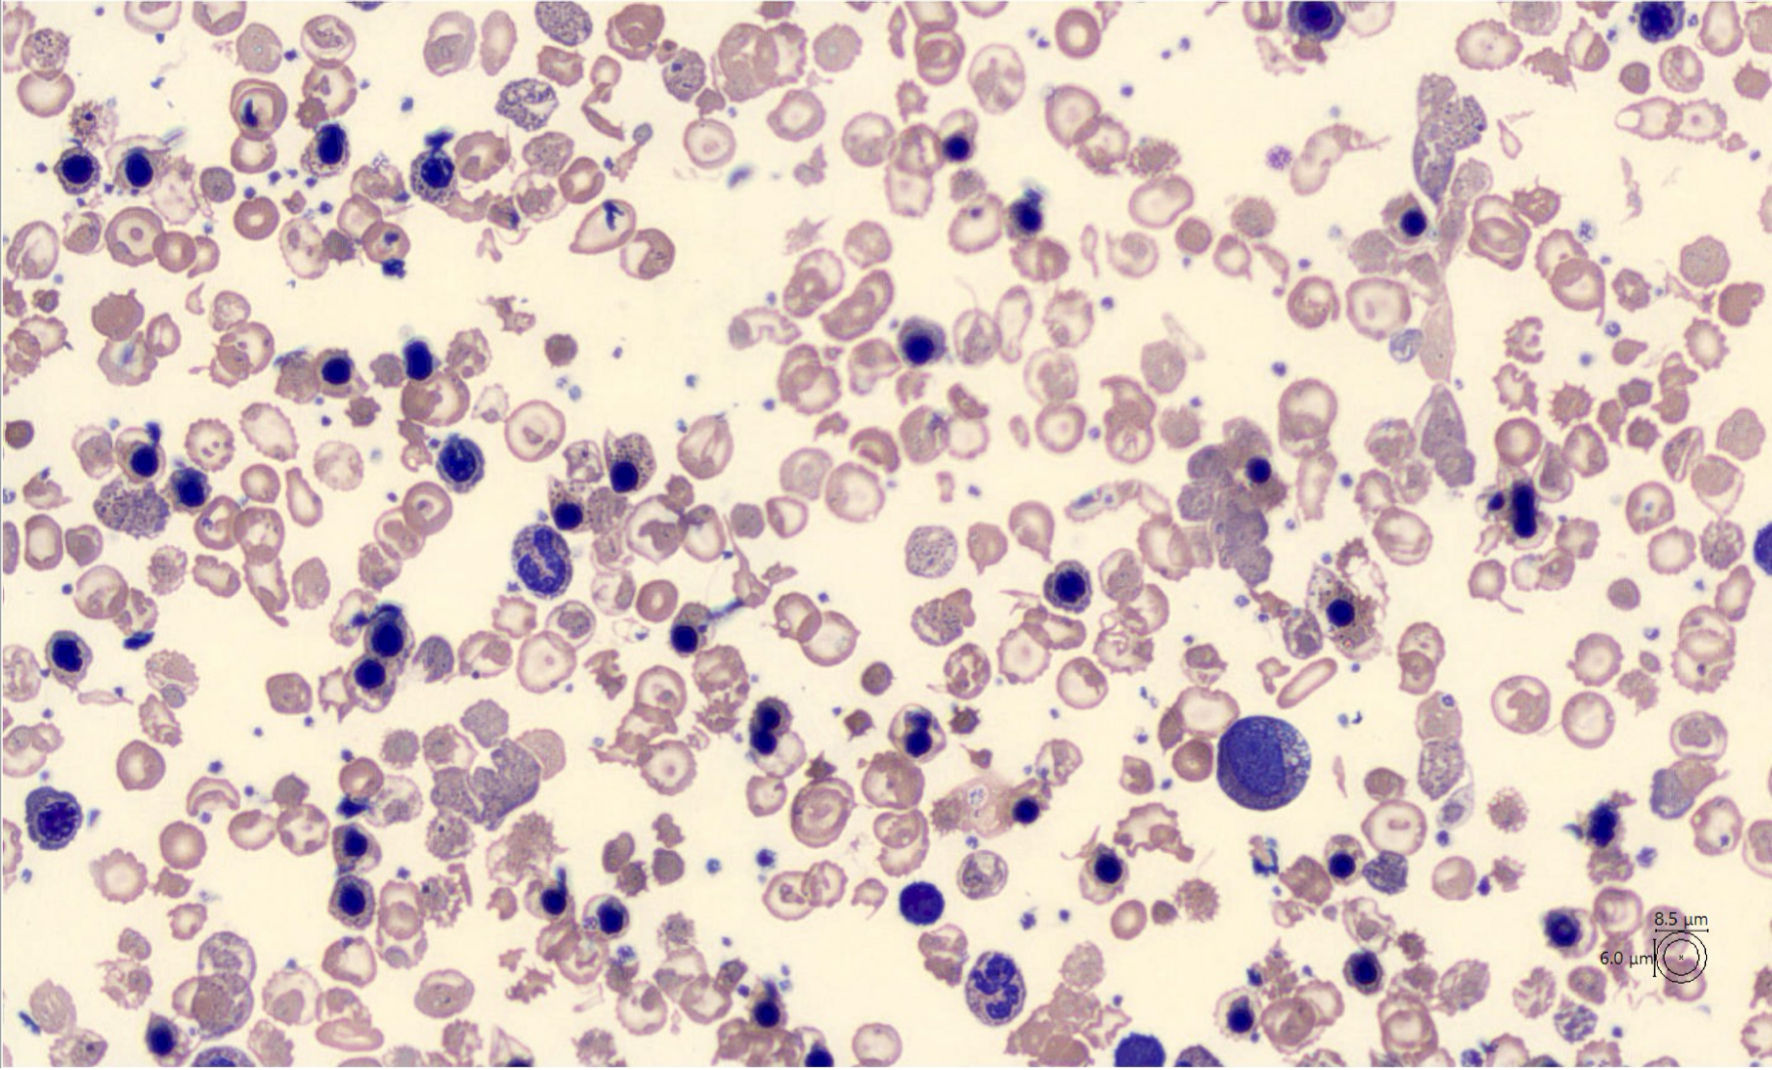
Figure 3. Peripheral blood smear (CellaVisions) showing marked anisopoikilocytosis of red blood cells (RBC) and the presence of erythroblasts predominantly in orthochromatic phase. The population of RBC consists mainly of schistocytes, dacrocytes, target cells and acanthocytes.
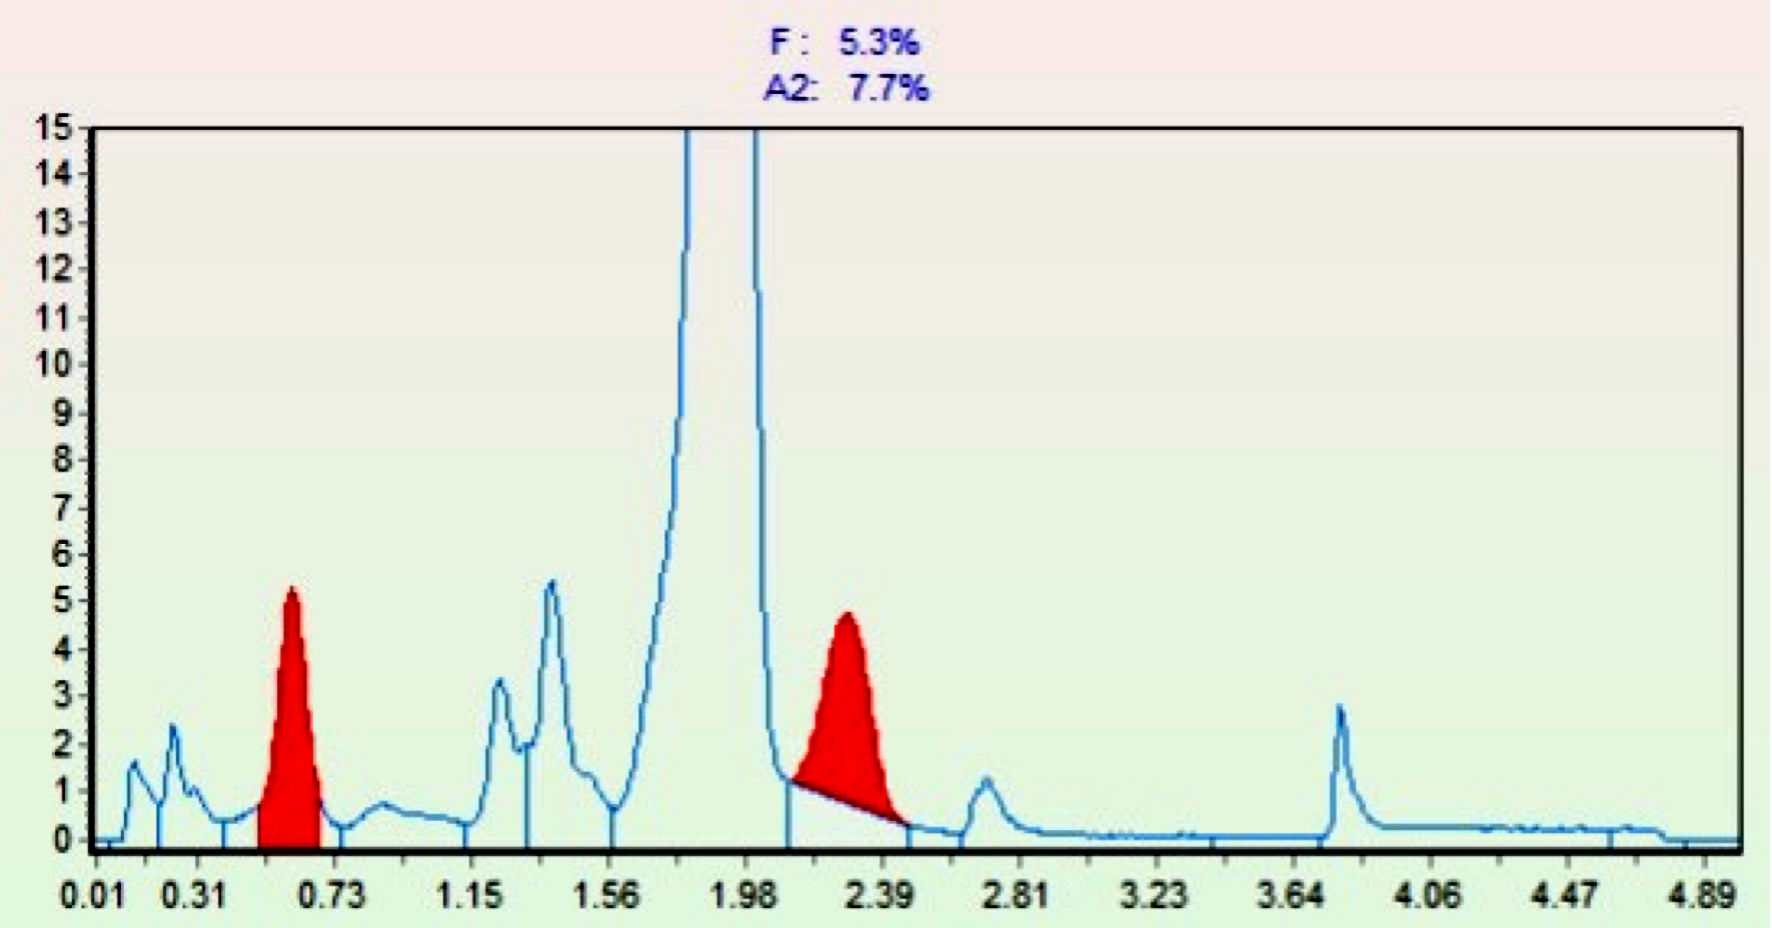
Figure 4. Chromatogram of pathological hemoglobins. On the abscissa (X-axis), retention times are reported, while on the ordinate (Y-axis), the percentages of the different hemoglobins are indicated. The red peaks show the increase in HbF (first red peak) and HbA2 (second red peak). Hb: hemoglobin.
Table
Table 1. Blood Count Pre- and Post-Transfusion
| Pre-transfusion blood chemistry tests | Post-transfusion blood chemistry tests | Blood chemistry tests at discharge |
|---|
| The first column shows the patient hemoglobin, platelet, and white blood cell values at the time of admission to the Emergency Department (before being transfused). The condition of severe anemia, thrombocytosis and leukocytosis is evident. The second column shows the post-transfusion values with an increase in hemoglobin values of 2.8 g/dL. The third column shows the hemoglobin, platelet and white blood cells values at discharge. Hemoglobin values remain stable after transfusion of two bags of prefiltered packed red blood cells with persistence of severe anemia, thrombocytosis and leukocytosis. |
| Hemoglobin | 4.6 g/dL | 7.4 g/dL | 6.9 g/dL |
| Platelets | 890,000/µL | 840,000/µL | 707,000/µL |
| White blood cells | 41,000/µL | 29,000/µL | 32,000/µL |