Journal of Hematology, ISSN 1927-1212 print, 1927-1220 online, Open Access
Article copyright, the authors; Journal compilation copyright, J Hematol and Elmer Press Inc
Journal website https://www.thejh.org

Original Article

Volume 13, Number 3, June 2024, pages 79-85


Steady-State Versus Chemotherapy-Based Stem Cell Mobilization in Multiple Myeloma: A Single-Center Study to Analyze Efficacy and Safety

Figure

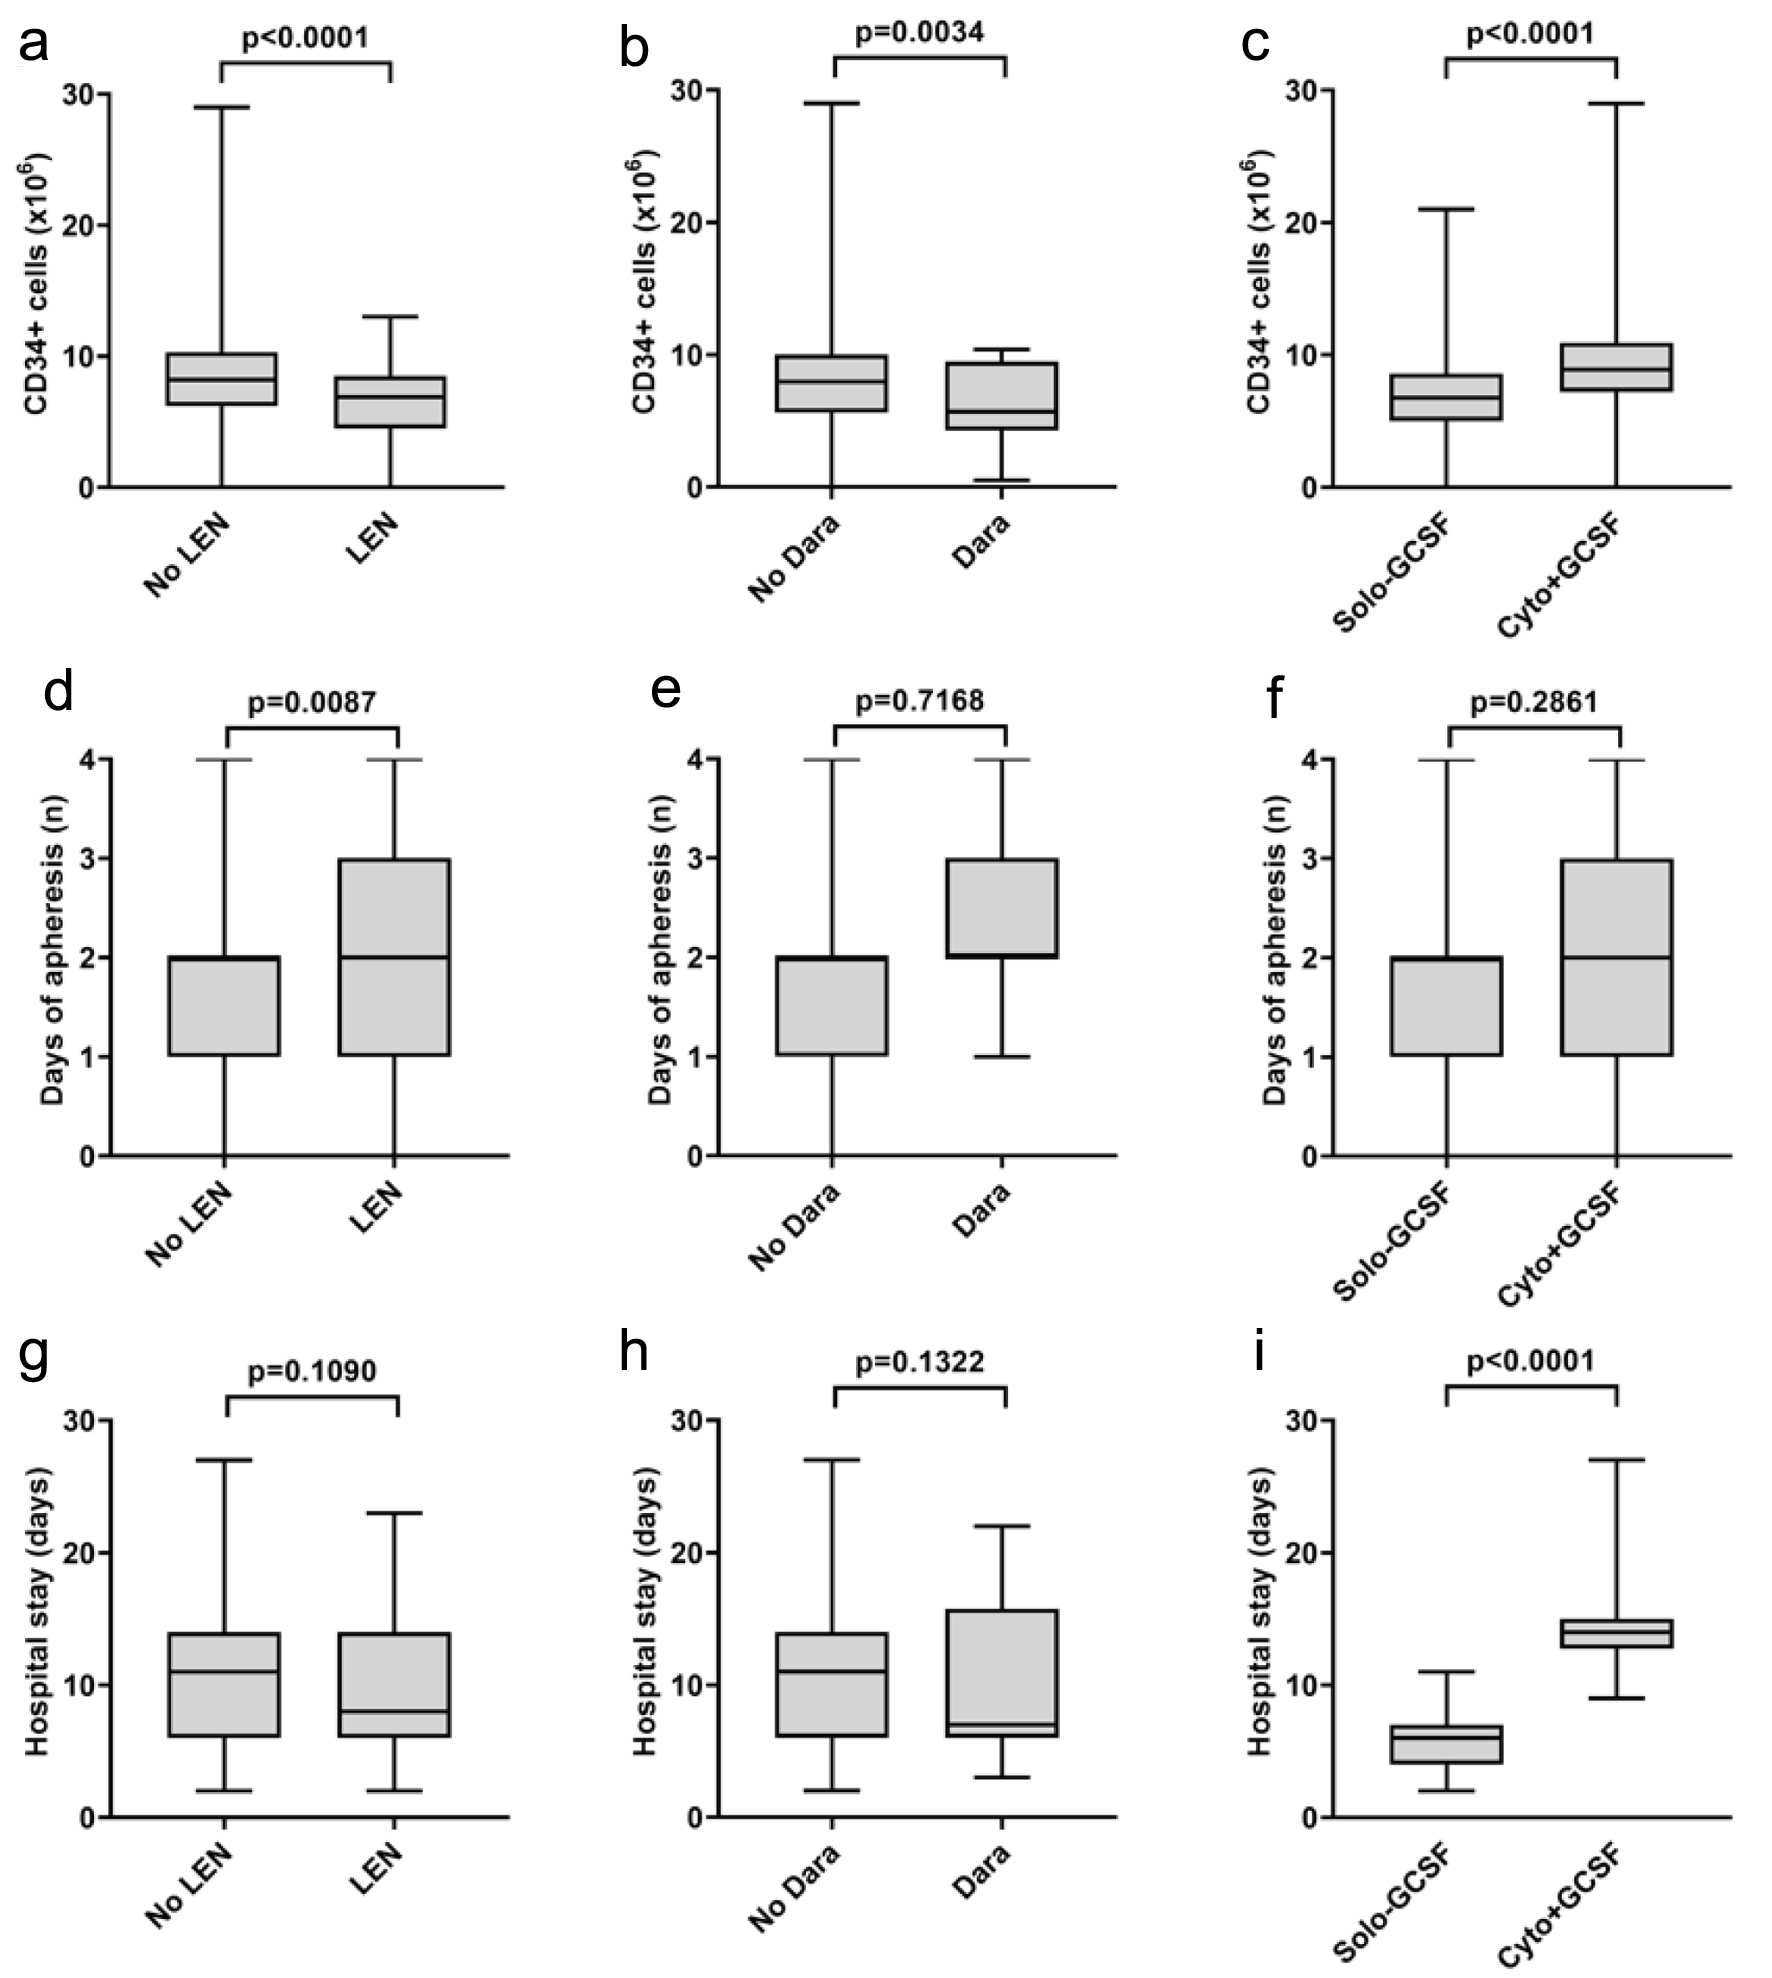
Figure 1.
Figure 1. The effect of LEN, Dara and mobilization strategy on the amount of bone marrow stem cells collected (a-c), the number of days of apheresis (d-f) and the length of hospital stay (g-i). LEN: lenalidomide; Dara: daratumumab; G-CSF: granulocyte colony-stimulating factor.

Tables

Table 1. Patient Characteristics and Comparison of Different Stem Cell Mobilization Approaches
 
CharacteristicsAll patients (n = 210)Chemotherapy + G-CSF group (n = 106)Solo G-CSF group (n = 104)P-value
G-CSF: granulocyte colony-stimulating factor; Ig: immunoglobulin; LCD: light chain disease; NS: non-secretory; R-ISS: revised International Scoring System; FISH: fluorescence in situ hybridization; VTD: bortezomib, thalidomide and dexamethasone; VRD: bortezomib, lenalidomide and dexamethasone; VCD: bortezomib, cyclophosphamide and dexamethasone; dg.: diagnosis; CR: complete response; VGPR: very good partial response; PR: partial response; SD: stable disease; AHSCT: autologous hematopoietic stem cell transplantation; ns: not significant.
Age, median (range)61 (32 - 75)59 (38 - 75)63 (32 - 75)ns
Sex, male/female (%)107/103 (51/49)55/51 (52/48)52/52 (50/50)ns
M-protein type, n (%)ns
  IgG128 (61)60 (58)68 (65)
  IgA39 (19)19 (18)20 (19)
  IgM1 (0.5)1 (1)0
  IgD2 (1)1 (1)1 (1)
  LCD37 (18)22 (21)15 (15)
  NS1 (0.5)1 (1)0
R-ISS, n (%)ns
  I34 (16)17 (16)17 (16)
  II58 (27)27 (25)31 (30)
  III77 (37)38 (36)39 (38)
  n/a41 (20)24 (23)17 (16)
FISH risk, n (%)ns
  Standard69 (33)34 (32)37 (36)
  High92 (44)46 (43)47 (45)
  n/a49 (23)26 (25)20 (19)
Previous lines of therapy, median (range)1 (1 - 6)1 (1 - 6)1 (1 - 3)ns
Number of previous lines, n (%)ns
  1152 (73)73 (69)83 (80)
  245 (22)27 (25)18 (17)
  ≥ 39 (5)6 (6)3 (3)
First-line therapyns
  VTD119 (57)63 (59)56 (54)
  VRD37 (18)14 (13)24 (23)
  VCD42 (20)23 (22)19 (18)
  Other12 (5)6 (6)5 (5)
Previous exposure of, n (%)ns
  Lenalidomid71 (34)30 (28)41 (39)
  Daratumumab18 (9)7 (7)11 (11)
  Venetoclax10 (5)5 (5)5 (5)
Time from dg. to mobilization, months, median (range)5.5 (2.6 - 107.2)5.5 (0.6 - 107.2)5.4 (2.6 - 23.2)ns
Disease status before mobilization, n (%)ns
  CR51 (24)24 (23)27 (26)
  VGPR91 (43)45 (42)46 (44)
  PR66 (32)35 (33)31 (30)
  SD2 (1)2 (2)0
Karnofsky status before AHSCT, %, median (range)90 (60 - 100)90 (60 - 100)90 (70 - 100)ns
Mobilization failure, n (%)5 (2)3 (3)11 (11)0.024
Plerixafor usage, n (%)61 (29)14 (13)47 (45)< 0.001
Days of apheresis, median (range)2 (0 - 4)2 (0 - 4)2 (1 - 4)ns
Total CD34+ stem cells, n, × 106, median (range)7.8 (0.5 - 29)8.9 (1.8 - 29)6.8 (0.5 - 21)< 0.001
Infectious complications, n (%)33 (16)29 (27)4 (4)< 0.001
Hospital stay, days, median (range)11 (2 - 27)14 (9 - 27)6 (2 - 11)< 0.001


Table 2. Univariate and Multivariable Logistic Regression Analyses of Disease Parameters, Associated With Infectious Complications, Plerixafor Use and Mobilization Failure
 
VariableUnivariate analysisMultivariable analysis
OR95% CIP-valueOR95% CIP-value
CI: confidence interval; FISH: fluorescence in situ hybridization; OR: odds ratio; VGPR: very good partial response.
Infectious complications
  Male sex1.3720.648 - 2.9070.407
  High-risk FISH1.5410.642 - 3.6960.330
  > 1 lines of therapy2.1560.988 - 4.7070.050
  Lenalidomide exposure0.3830.150 - 0.9760.0391.6770.539 - 5.2190.372
  Daratumumab exposure0.2940.038 - 2.2900.216
  Below VGPR disease status1.2350.568 - 2.6850.594
  Chemomobilization9.4163.176 - 27.915< 0.0017.3922.366 - 23.0900.001
Plerixafor use
  Male sex1.5820.866 - 2.8900.135
  High-risk FISH1.0610.546 - 2.0620.862
  > 1 lines of therapy1.4730.761 - 2.8540.249
  Lenalidomide exposure2.3091.247 - 4.2760.0070.6730.294 - 1.5420.349
  Daratumumab exposure10.7983.389 - 34.406< 0.0010.0770.014 - 0.4310.003
  Below VGPR disease status1.5480.830 - 2.8850.168
  Chemomobilization0.1850.093 - 0.365< 0.0010.1760.076 - 0.407< 0.001
Mobilization failure
  Male sex1.9530.166 - 1.5830.278
  High-risk FISH1.1540.235 - 3.1911.000
  > 1 lines of therapy1.1680.257 - 2.8520.759
  Lenalidomide exposure2.8170.937 - 8.4750.056
  Daratumumab exposure1.8760.386 - 9.0910.429
  Below VGPR disease status1.2120.366 - 4.0140.753
  Chemomobilization0.2460.067 - 0.9100.0244.550.850 - 24.3570.077