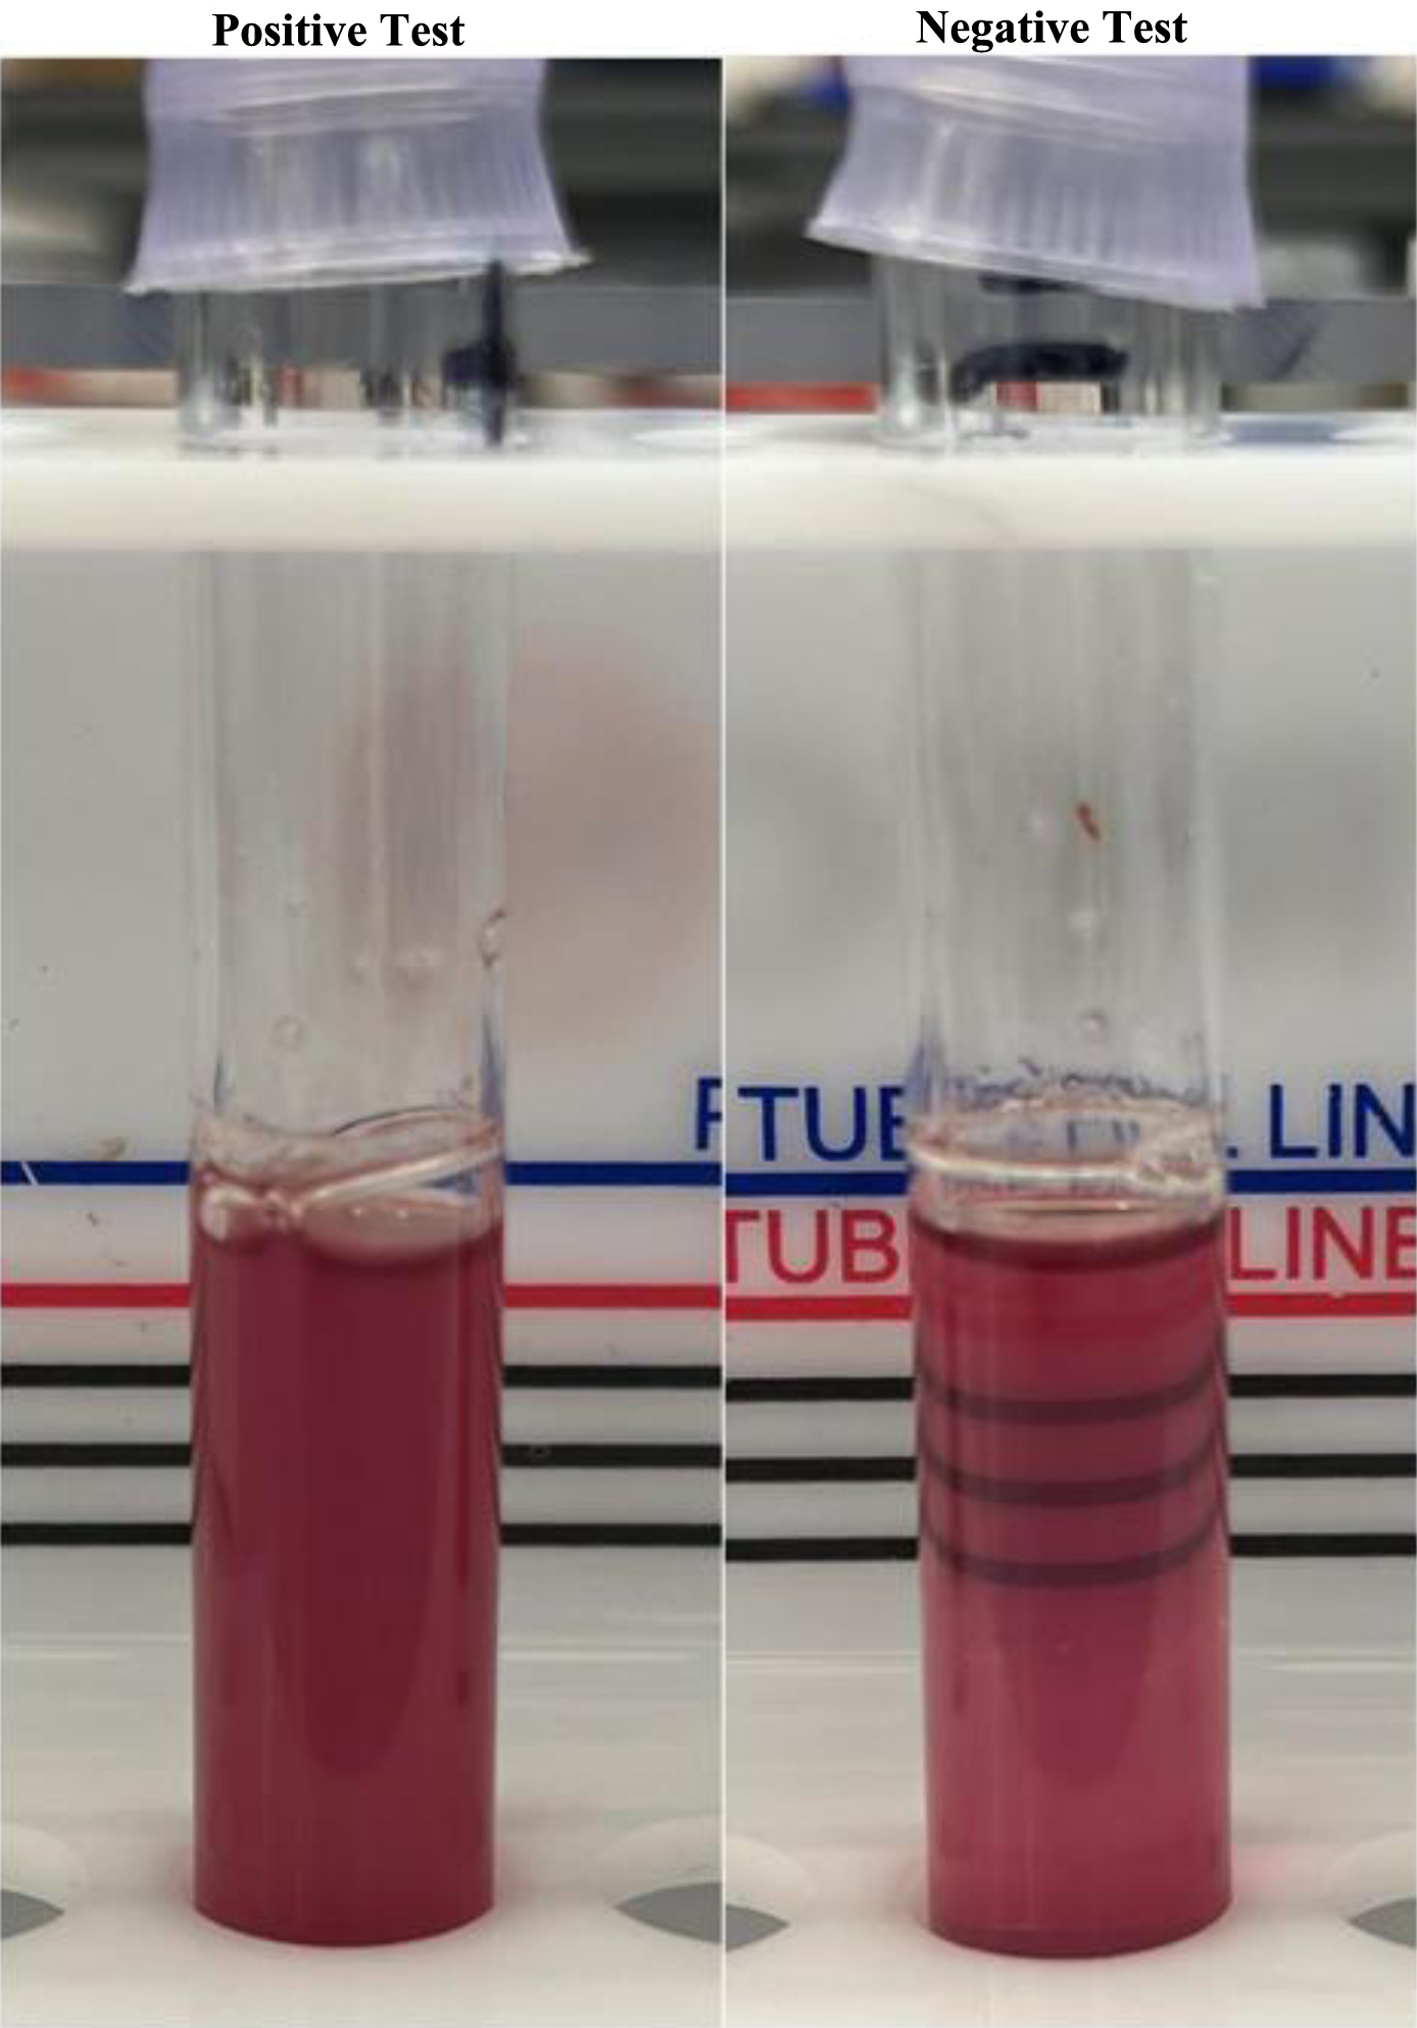
Figure 1. Sickle cell solubility test in the laboratory. The presence of hemoglobin S is marked by a turbid solution (on the left). The control solution is clear, allowing for visualization of the lines (right).
| Journal of Hematology, ISSN 1927-1212 print, 1927-1220 online, Open Access |
| Article copyright, the authors; Journal compilation copyright, J Hematol and Elmer Press Inc |
| Journal website https://www.thejh.org |
Review
Volume 13, Number 3, June 2024, pages 53-60
Sickle Cell Screening in Adults: A Current Review of Point-of-Care Testing
Figures

