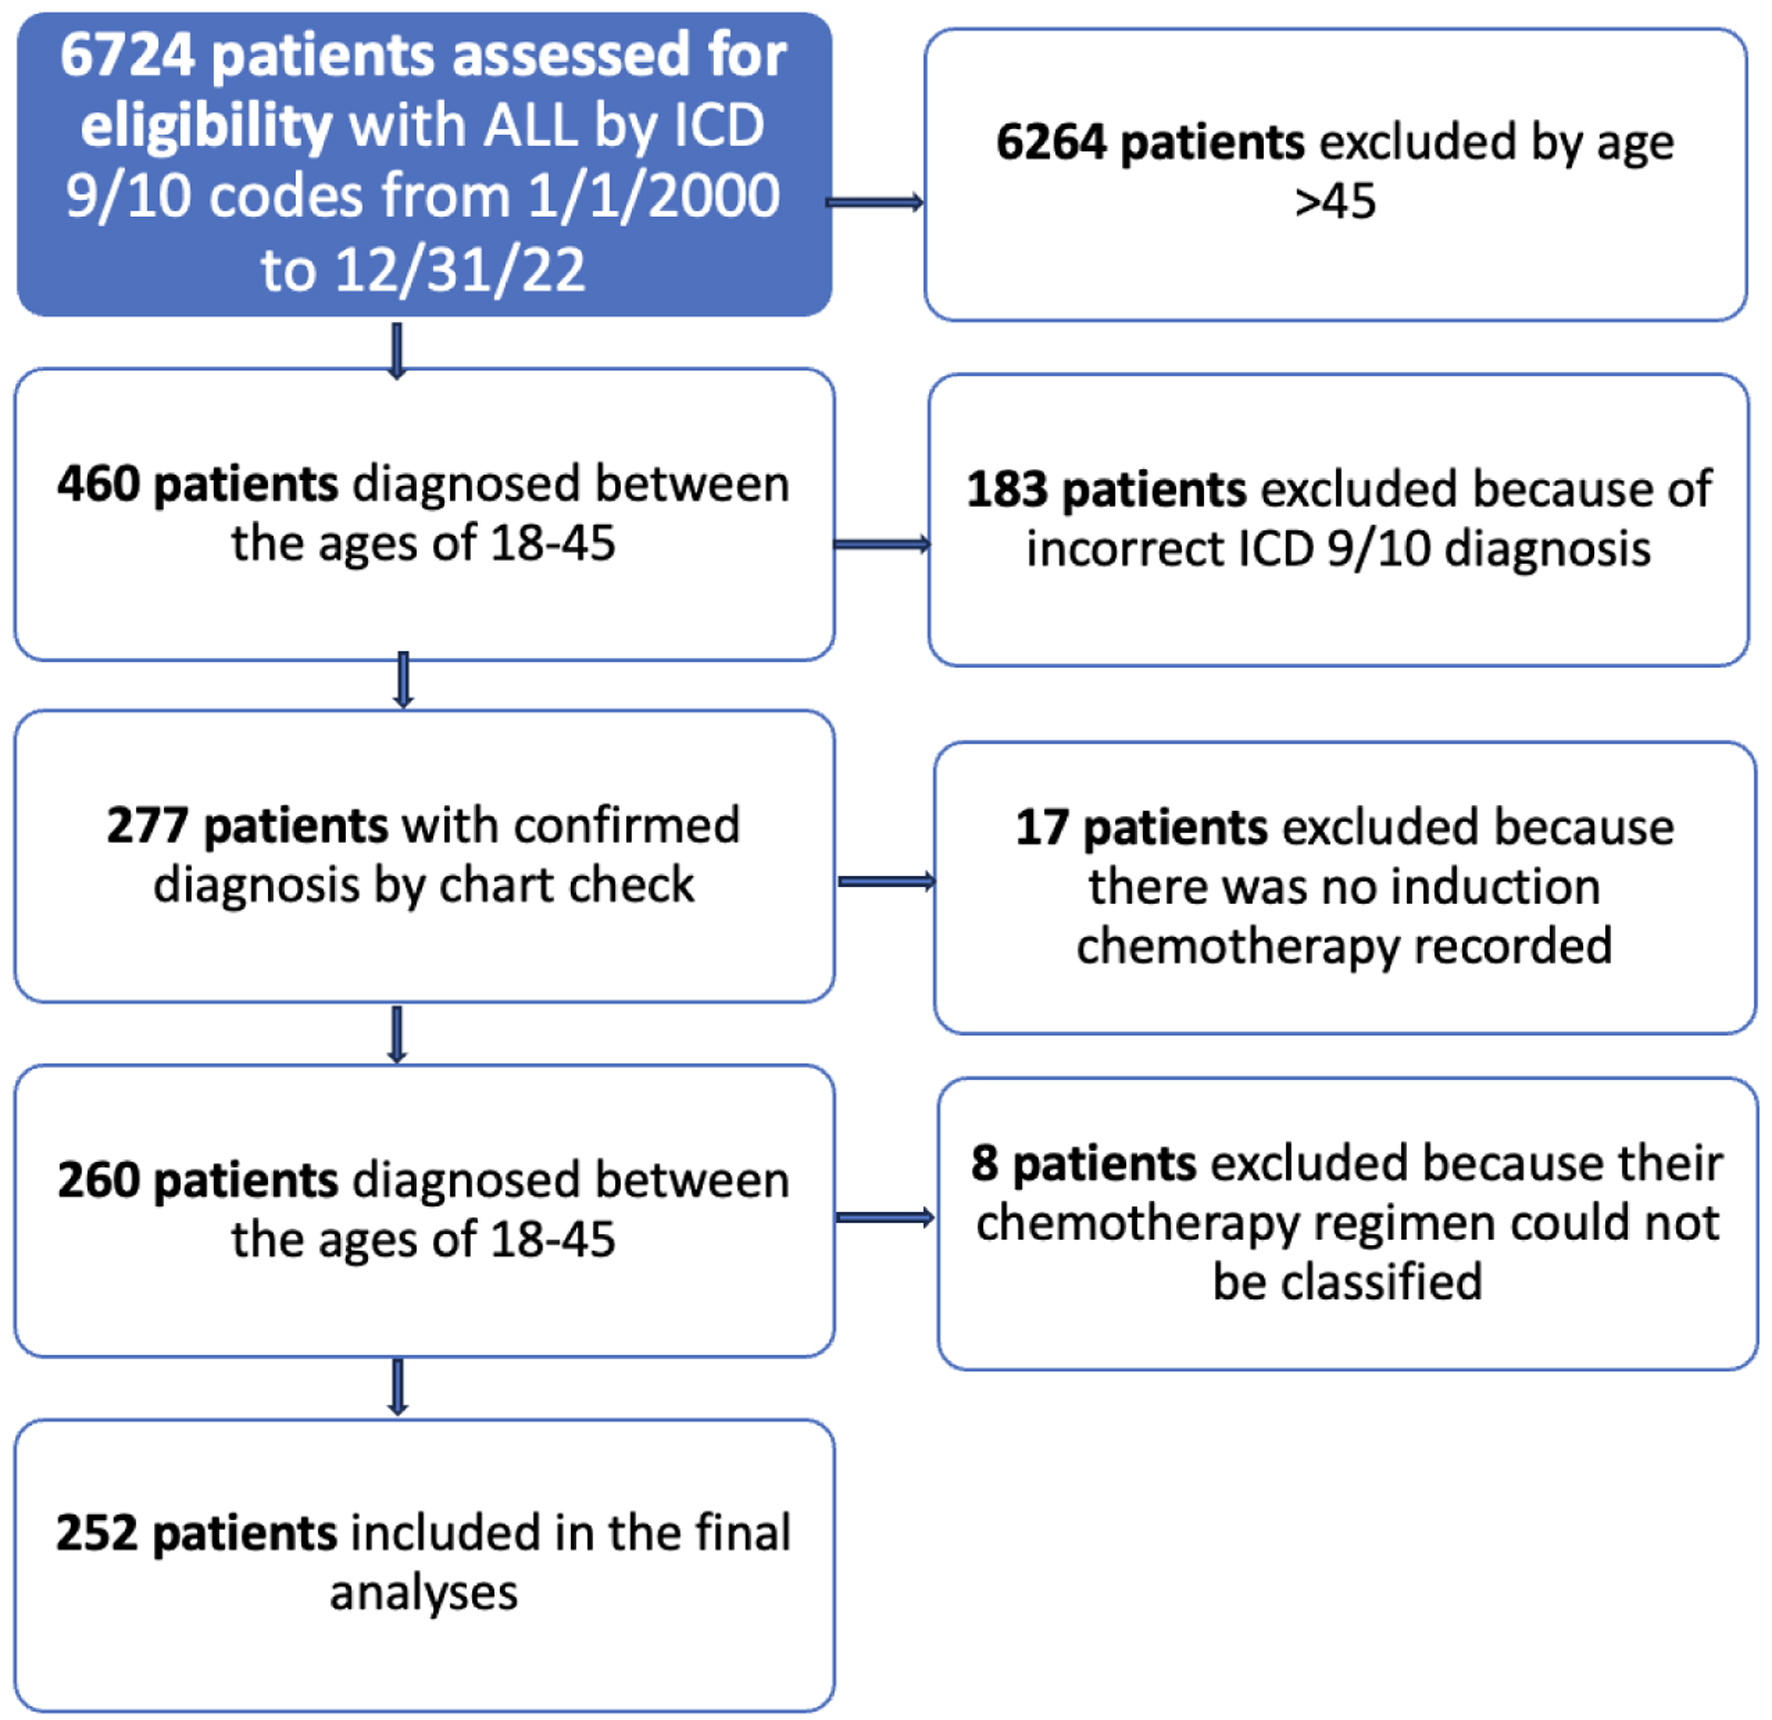
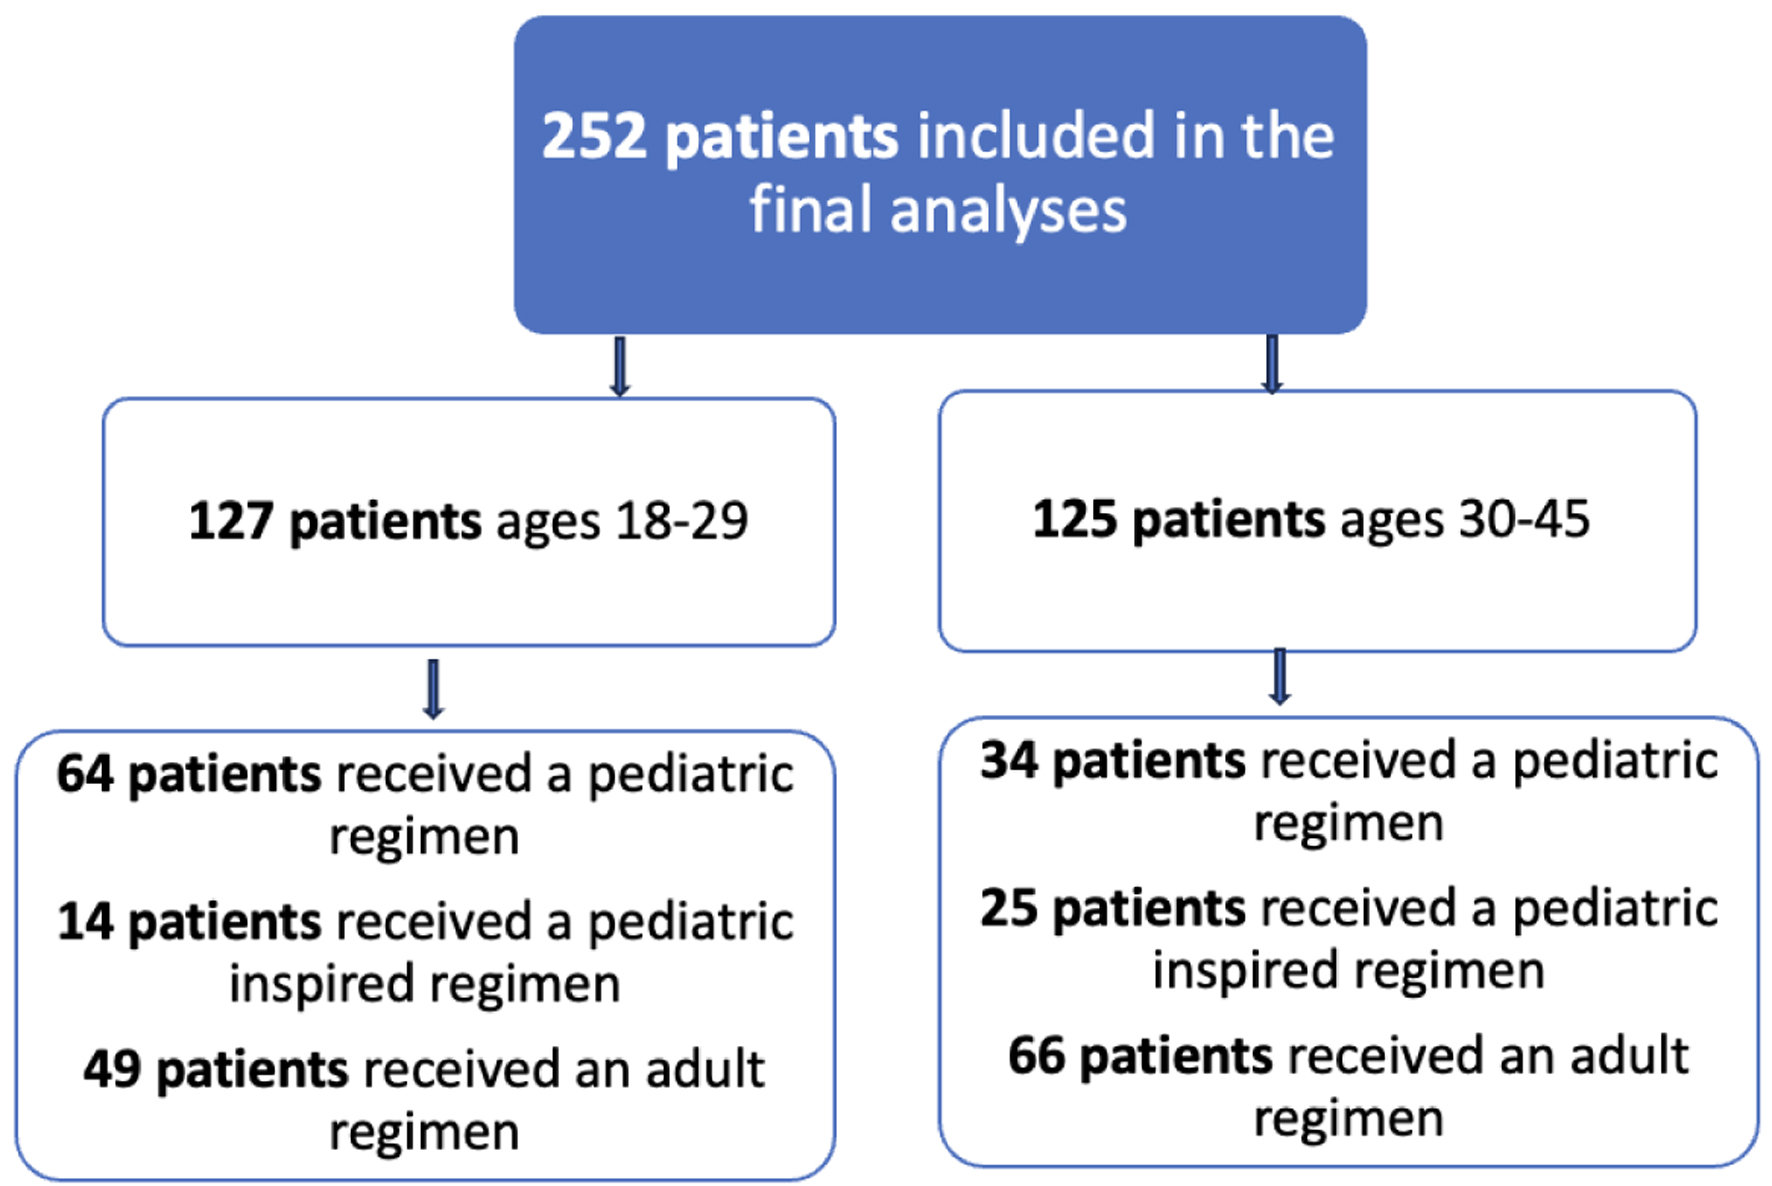
Figure 1. Flow diagram of patients from VINCI included in the final analysis.
| Journal of Hematology, ISSN 1927-1212 print, 1927-1220 online, Open Access |
| Article copyright, the authors; Journal compilation copyright, J Hematol and Elmer Press Inc |
| Journal website https://www.thejh.org |
Original Article
Volume 13, Number 4, August 2024, pages 150-157
Disparities in Acute Lymphocytic Leukemia Outcomes Among Young Adults
Figures
Tables
| Characteristic | N (%) |
|---|---|
| ALL: acute lymphocytic leukemia; allo-HSCT: allogeneic hematopoietic stem cell transplantation; MRC-ECOG: Medical Research Council-Eastern Cooperative Oncology Group; MPAL: mixed-phenotype acute leukemia. | |
| Age at diagnosis | |
| 18 - 29 | 127 (50.4) |
| 30 - 45 | 125 (49.6) |
| Race | |
| White, non-Hispanic | 147 (58.3) |
| Black, non-Hispanic | 33 (13) |
| Hispanic | 33 (13) |
| Other/unknown | 39 (15.4) |
| ALL subtype | |
| B-cell (include pre-B) | 158 (65) |
| T-cell | 71 (29) |
| MPALs | 12 (5) |
| Unknown | 2 (0.8) |
| Allo-HSCT | |
| Yes | 108 (42.8) |
| No | 144 (57) |
| Induction chemo regimen | |
| Adult | 115 (45.6) |
| Pediatric | 98 (39) |
| Pediatric-inspired | 39 (15) |
| MRC-ECOG cytogenetic risk classification | |
| High | 31 (12) |
| Intermediate | 79 (31) |
| Standard | 9 (3.6) |
| Unknown | 89 (35) |
| Philadelphia chromosome positive (Ph+) | 44 (17.4) |
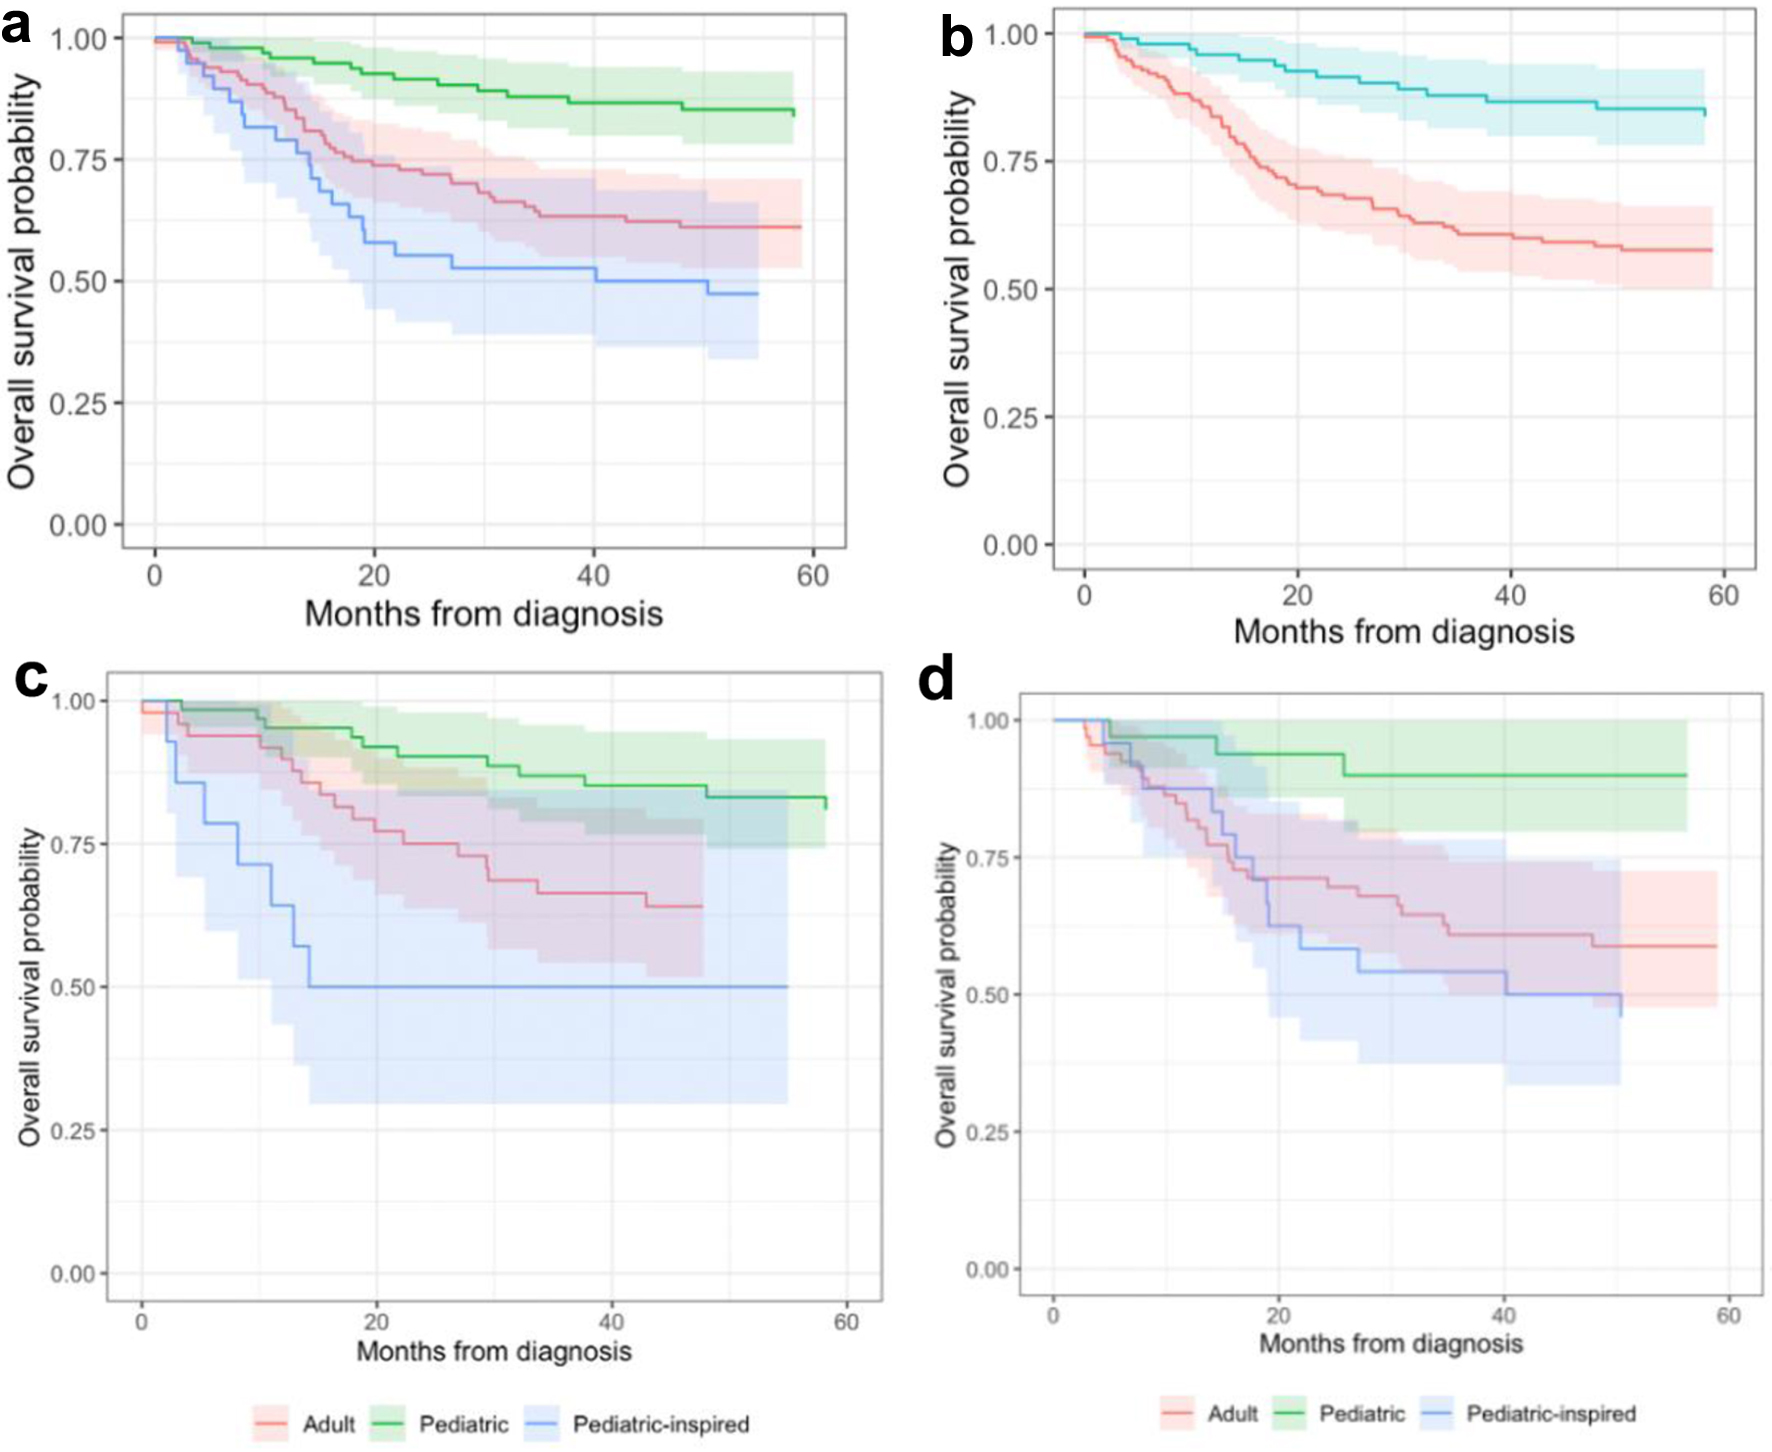
| 5-year OS estimate (95% CI), n | |||
|---|---|---|---|
| 18 - 29 years old | 30 - 45 years old | 18 - 45 years old | |
| CI: confidence interval; OS: overall survival; MRC-ECOG: Medical Research Council-Eastern Cooperative Oncology Group. | |||
| Treatment regimen | |||
| Pediatric | 81 (71, 92), n = 64 | 90 (80, 100), n = 34 | 84% (76, 92), n = 98 |
| Pediatric inspired | 50 (30, 84), n = 14 | 46 (30, 71), n = 25 | 47% (34, 66), n = 39 |
| Adult | 64 (52, 79), n =49 | 59 (48, 73), n = 66 | 61 (53, 71), n = 115 |
| Age category (95% CI), n | |||
| 18 - 29 years old | 30 - 45 years old | 18 - 45 years old | |
| MRC-ECOG cytogenetic risk | |||
| High | 74 (56, 96), n = 19 | 100 (100, 100), n = 12 | 83 (70, 98), n = 31 |
| Intermediate | 70 (57, 87), n = 37 | 69 (56, 85), n = 42 | 70 (60, 81), n = 79 |
| Ph+ | 82 (62, 100), n = 12 | 63 (48, 83), n = 32 | 69 (53, 84), n = 44 |
| Standard | 40 (15, 100), n = 8 | 0 (-, -), n = 1 | 36 (13, 99), n = 9 |
| Unknown | 72 (60, 86), n = 49 | 47 (32, 67), n = 30 | 61 (51, 73), n = 99 |
| Race/ethnicity | 5-year OS (95% CI) |
|---|---|
| CI: confidence interval; OS: overall survival. | |
| Black | 59% (45, 77), n = 39 |
| Hispanic | 73% (58, 91), n = 33 |
| White | 72% (65, 79), n = 163 |
| Other | 49% (33, 72), n = 28 |
| Unknown | 50% (30, 84), n = 14 |