Figures
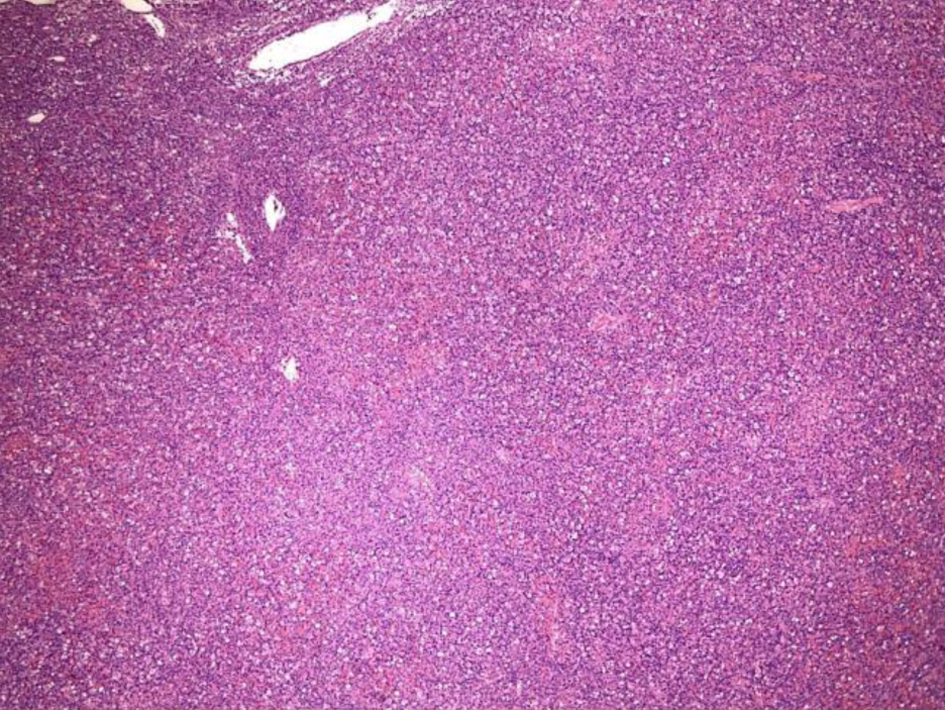
Figure 1. Low-power view (× 4) of left inguinal lymph node from an excisional biopsy that shows effacement of the lymph node architecture.
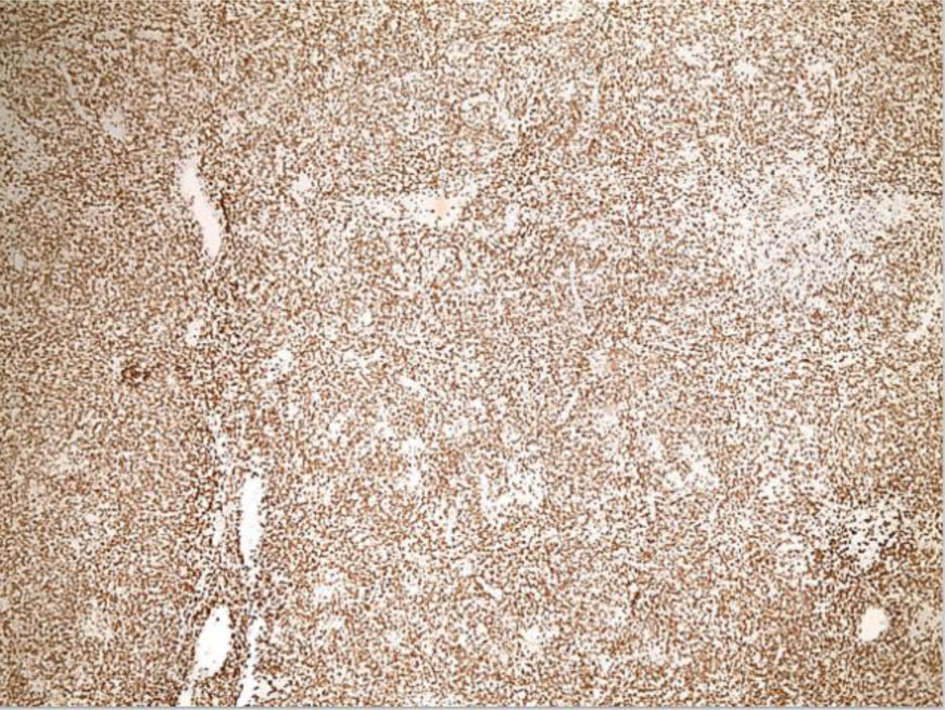
Figure 2. Low-power view (× 4) of left inguinal lymph node from an excisional biopsy after CD3 staining shows effacement of the lymph node architecture is predominantly by CD3+ T cells.
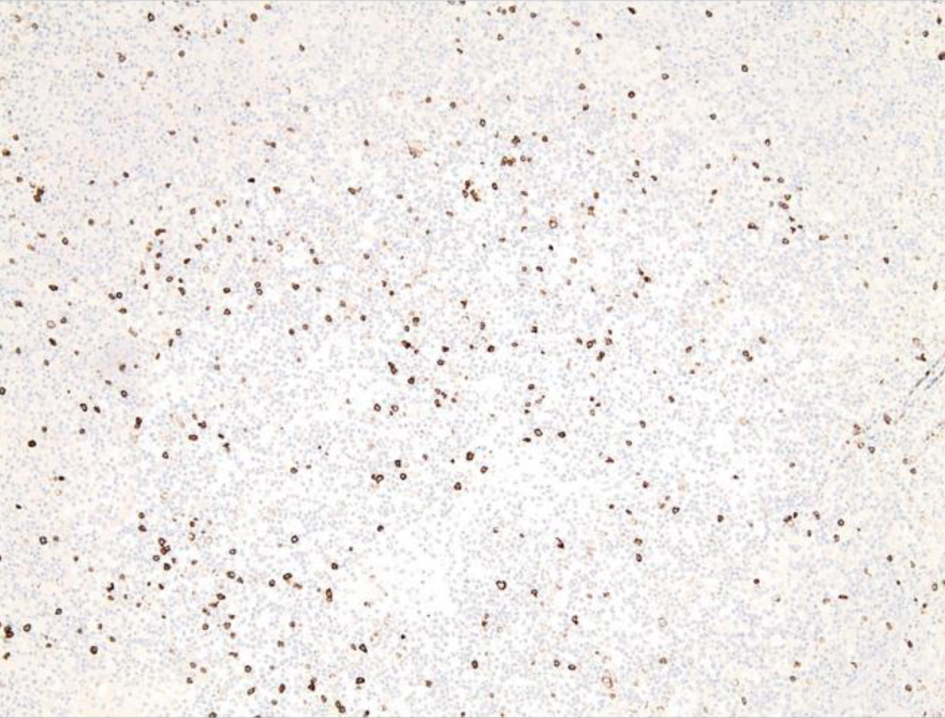
Figure 3. Low-power view of left inguinal lymph node from an excisional biopsy after CD20 staining shows scattered CD20+ B cells.
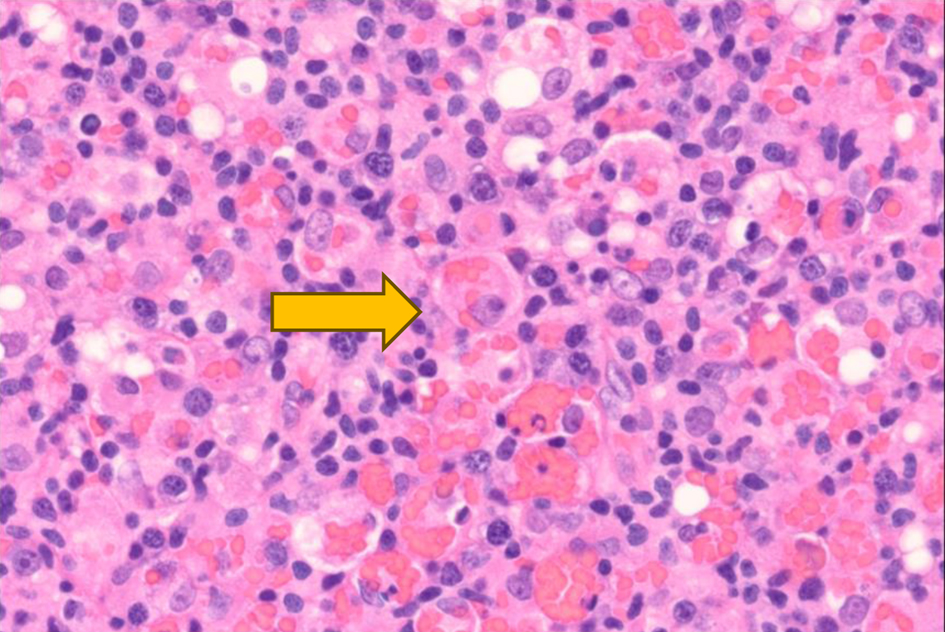
Figure 4. High-power view (× 60) of left inguinal lymph node after hematoxylin and eosin staining reveals histocytes with engulfed red blood cells (× 60) as indicated by the yellow arrow.
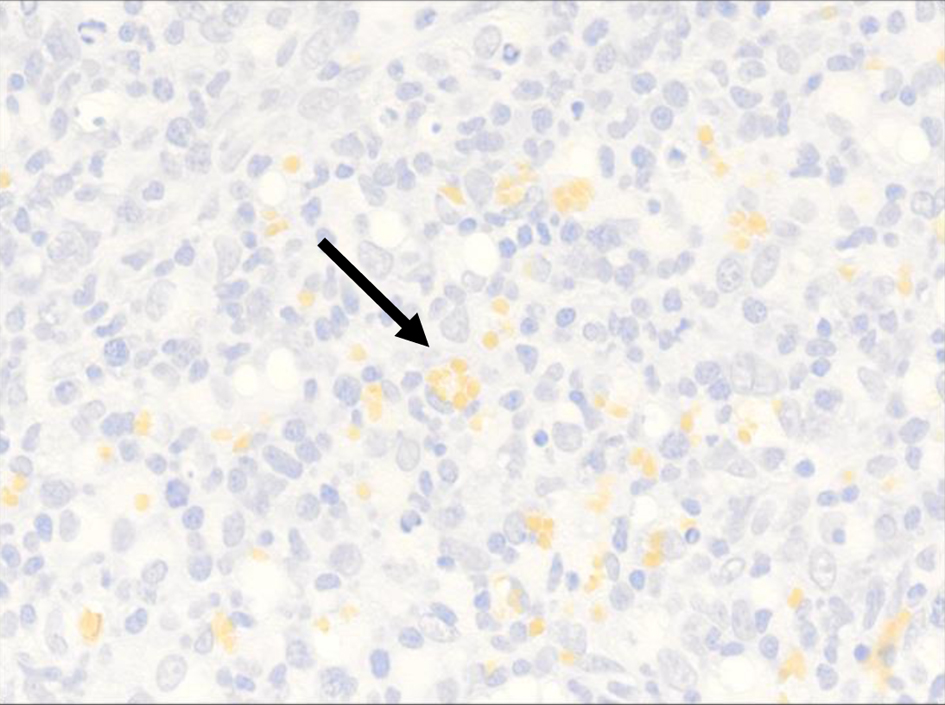
Figure 5. High-power view (× 40) of CD235 highlights intracytoplasmic red blood cells within the histiocyte (black arrow).
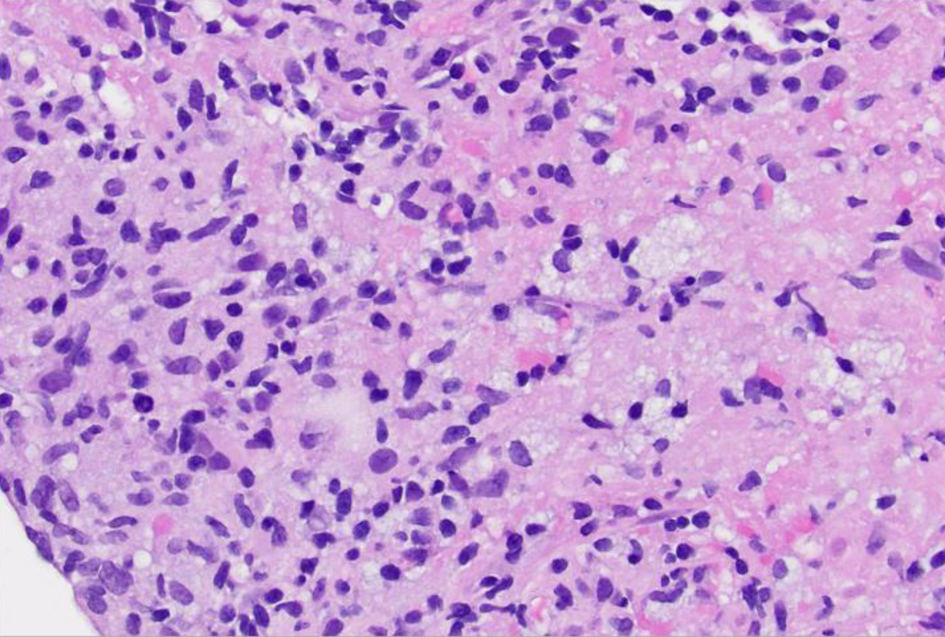
Figure 6. High-power view (× 40) of left lung lesion transbronchial biopsy after hematoxylin and eosin staining reveals infiltrate composed of atypical lymphocytes, some with prominent nucleoli.
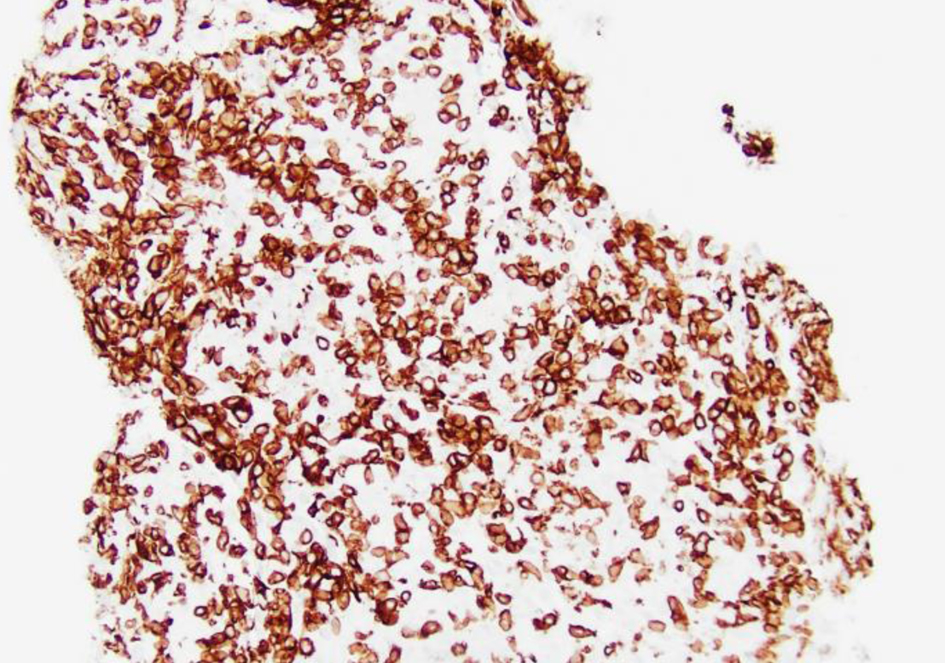
Figure 7. Low-power view (× 20) of left lung lesion biopsy after CD3 staining shows atypical lymphocytic infiltrate predominantly composed of CD3+ T cells.
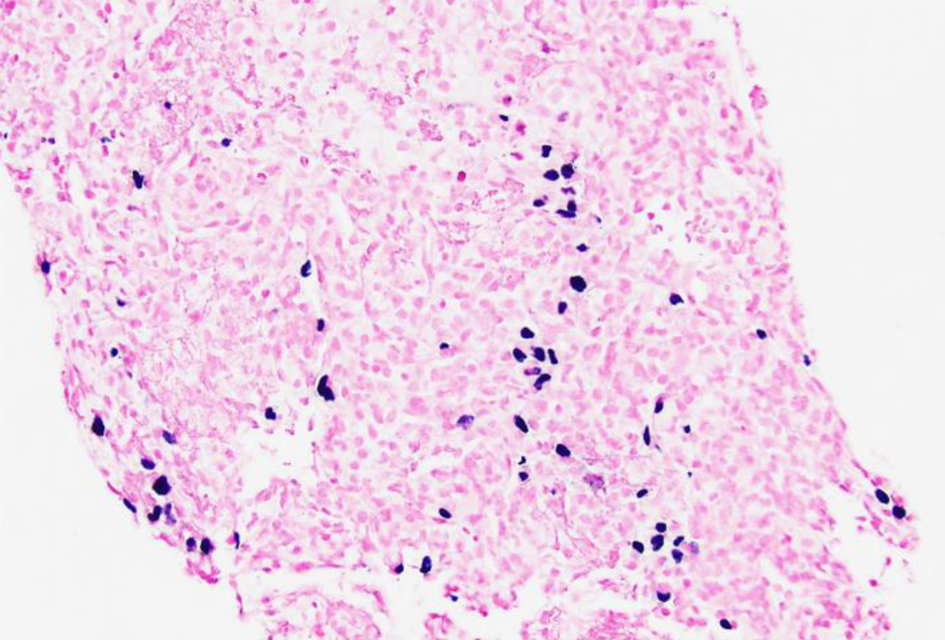
Figure 8. Low-power view (× 20) of left lung lesion biopsy of Epstein-Barr virus (EBV) detection by in situ hybridization (EBER) stain showing that focal large cells within the atypical lymphocytic infiltrate are positive for EBV.
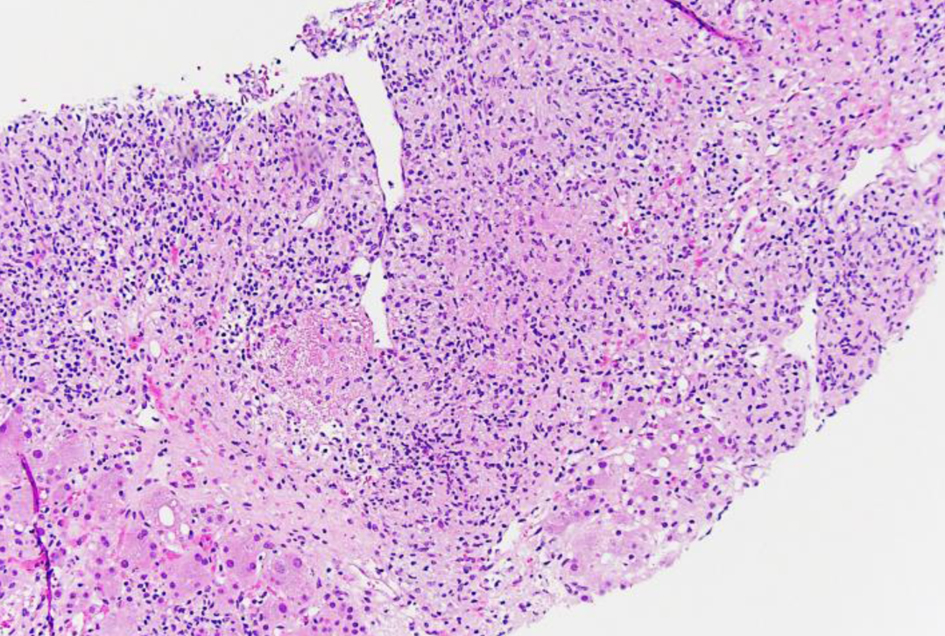
Figure 9. Low-power view (× 10) of liver core biopsy by hematoxylin and eosin stain showing infiltrate composed of atypical lymphocytes with adjacent viable liver.
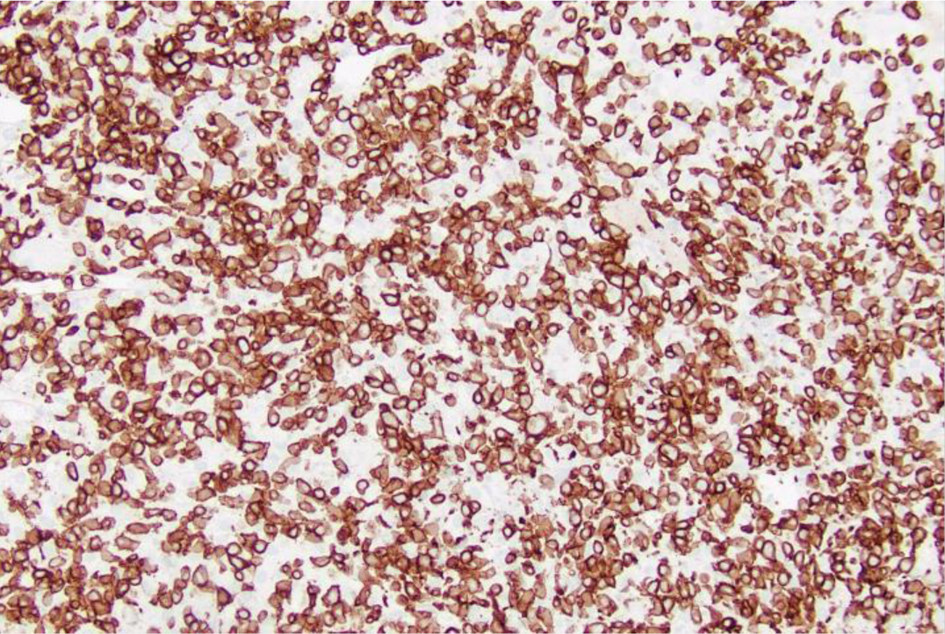
Figure 10. Low-power view (× 20) of liver core biopsy showing CD3+ staining is strongly positive indicating presence of numerous T cells within atypical lymphoid infiltrate.
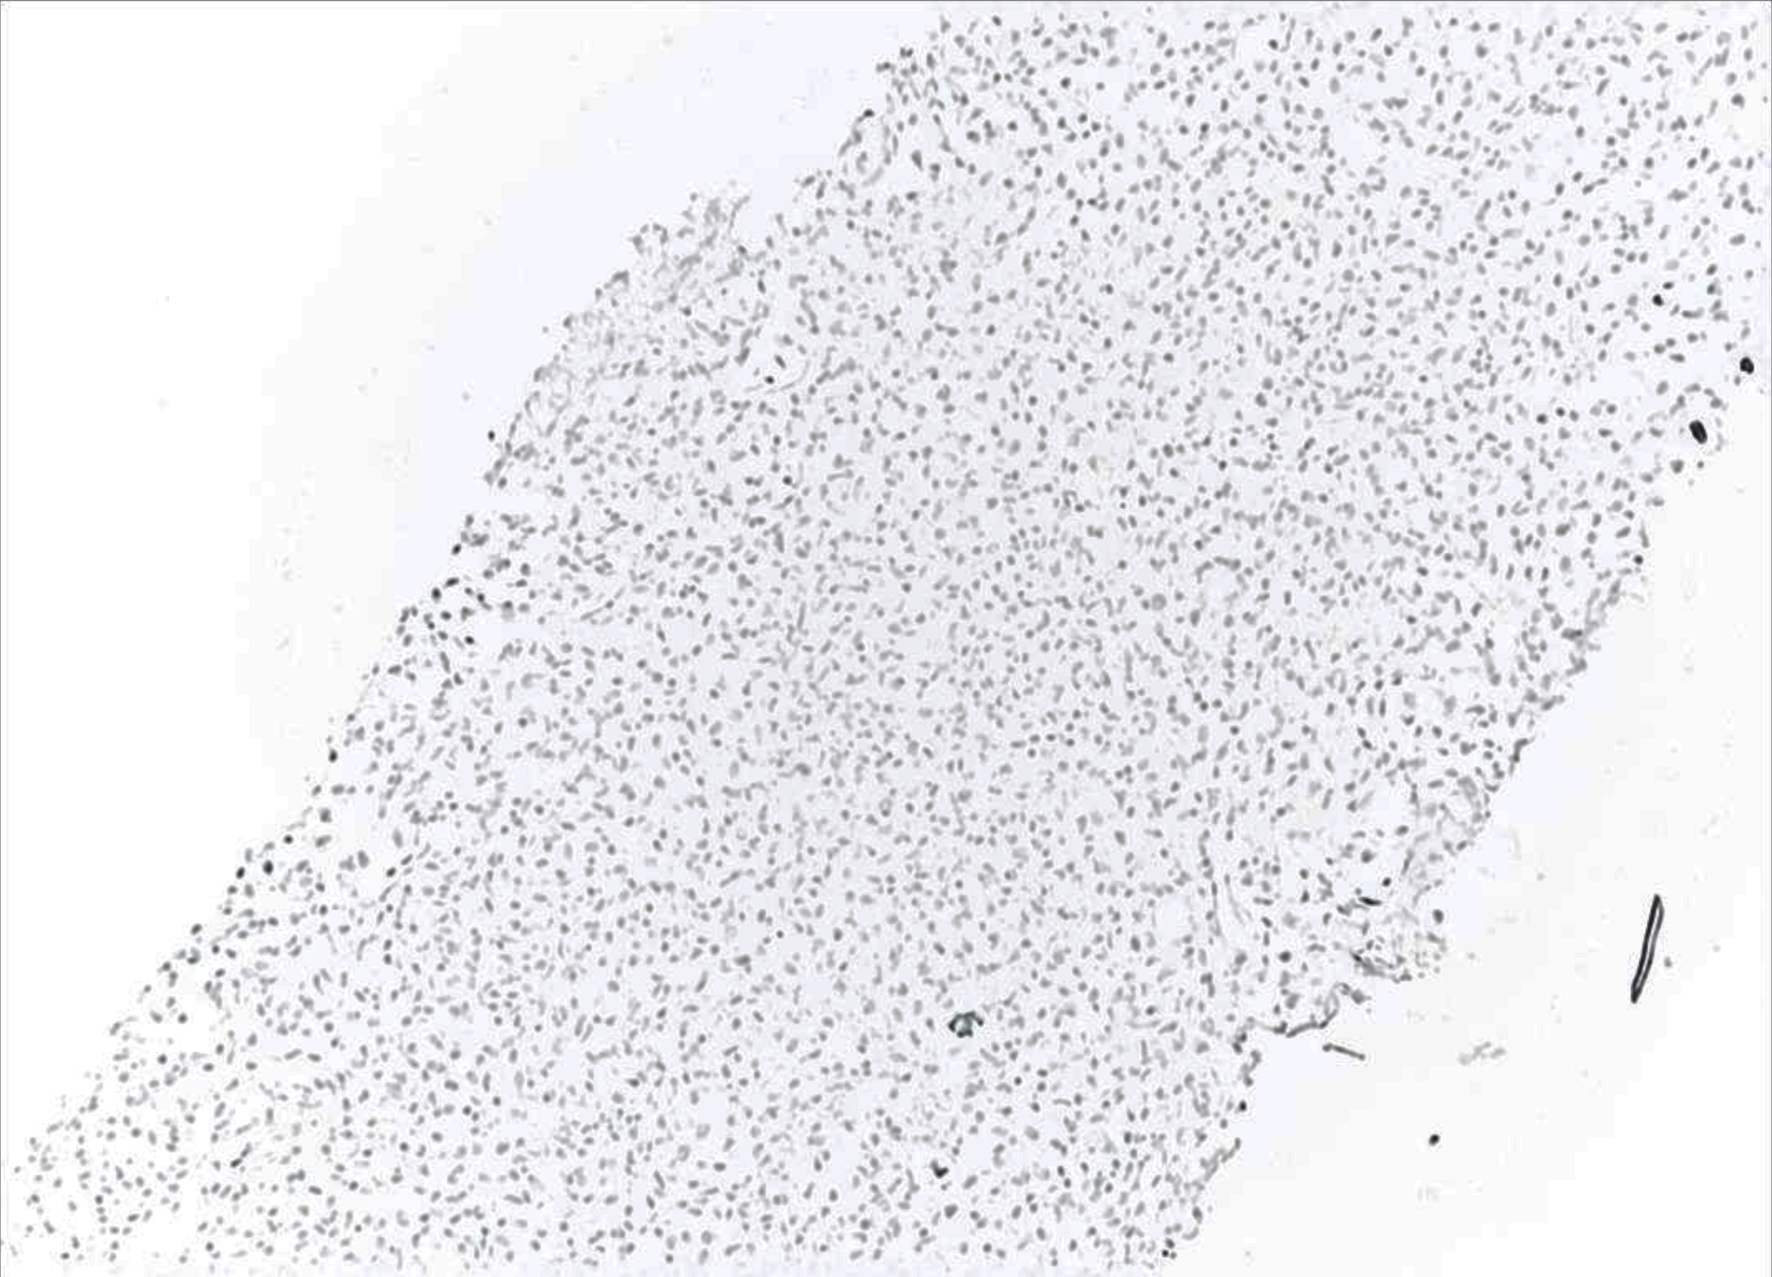
Figure 11. Low-power view (× 10) of liver core biopsy showing CD56 marker is negative indicating the lack natural killer (NK) cells.
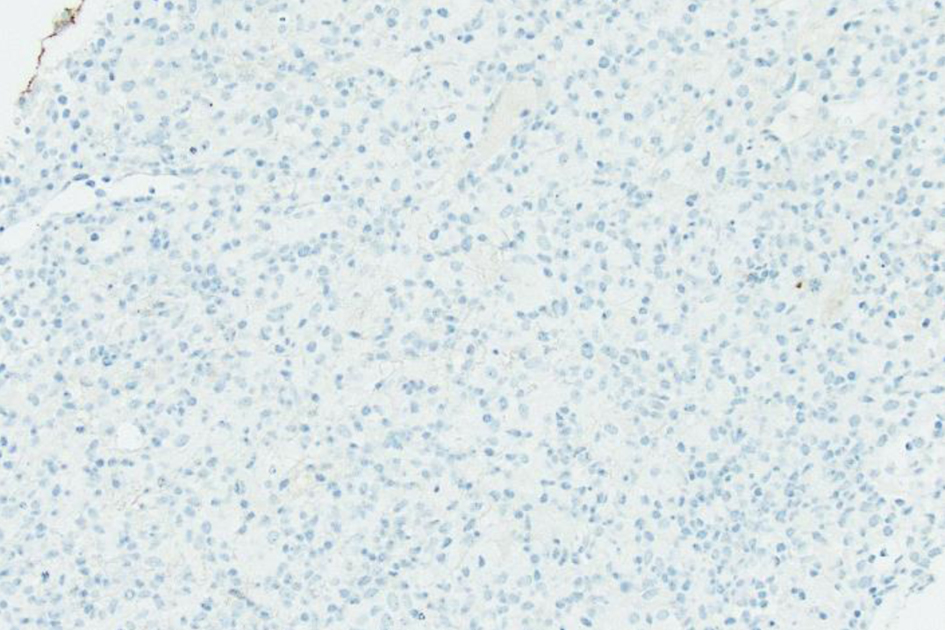
Figure 12. Low-power view (× 20) of liver core biopsy by CD20 stain, which is largely negative, reveals lymphoid infiltrate containing rare B cells.
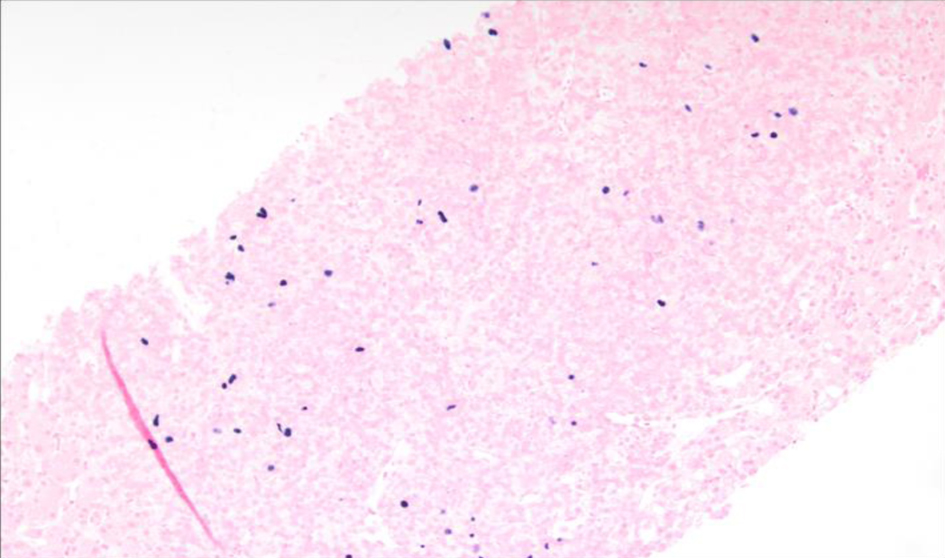
Figure 13. Low-power view (× 10) of Epstein-Barr virus (EBV) in situ hybridization (ISH) or EBV encoded small RNA (EBER) ISH indicating scattered EBV+ cells within the liver parenchyma.
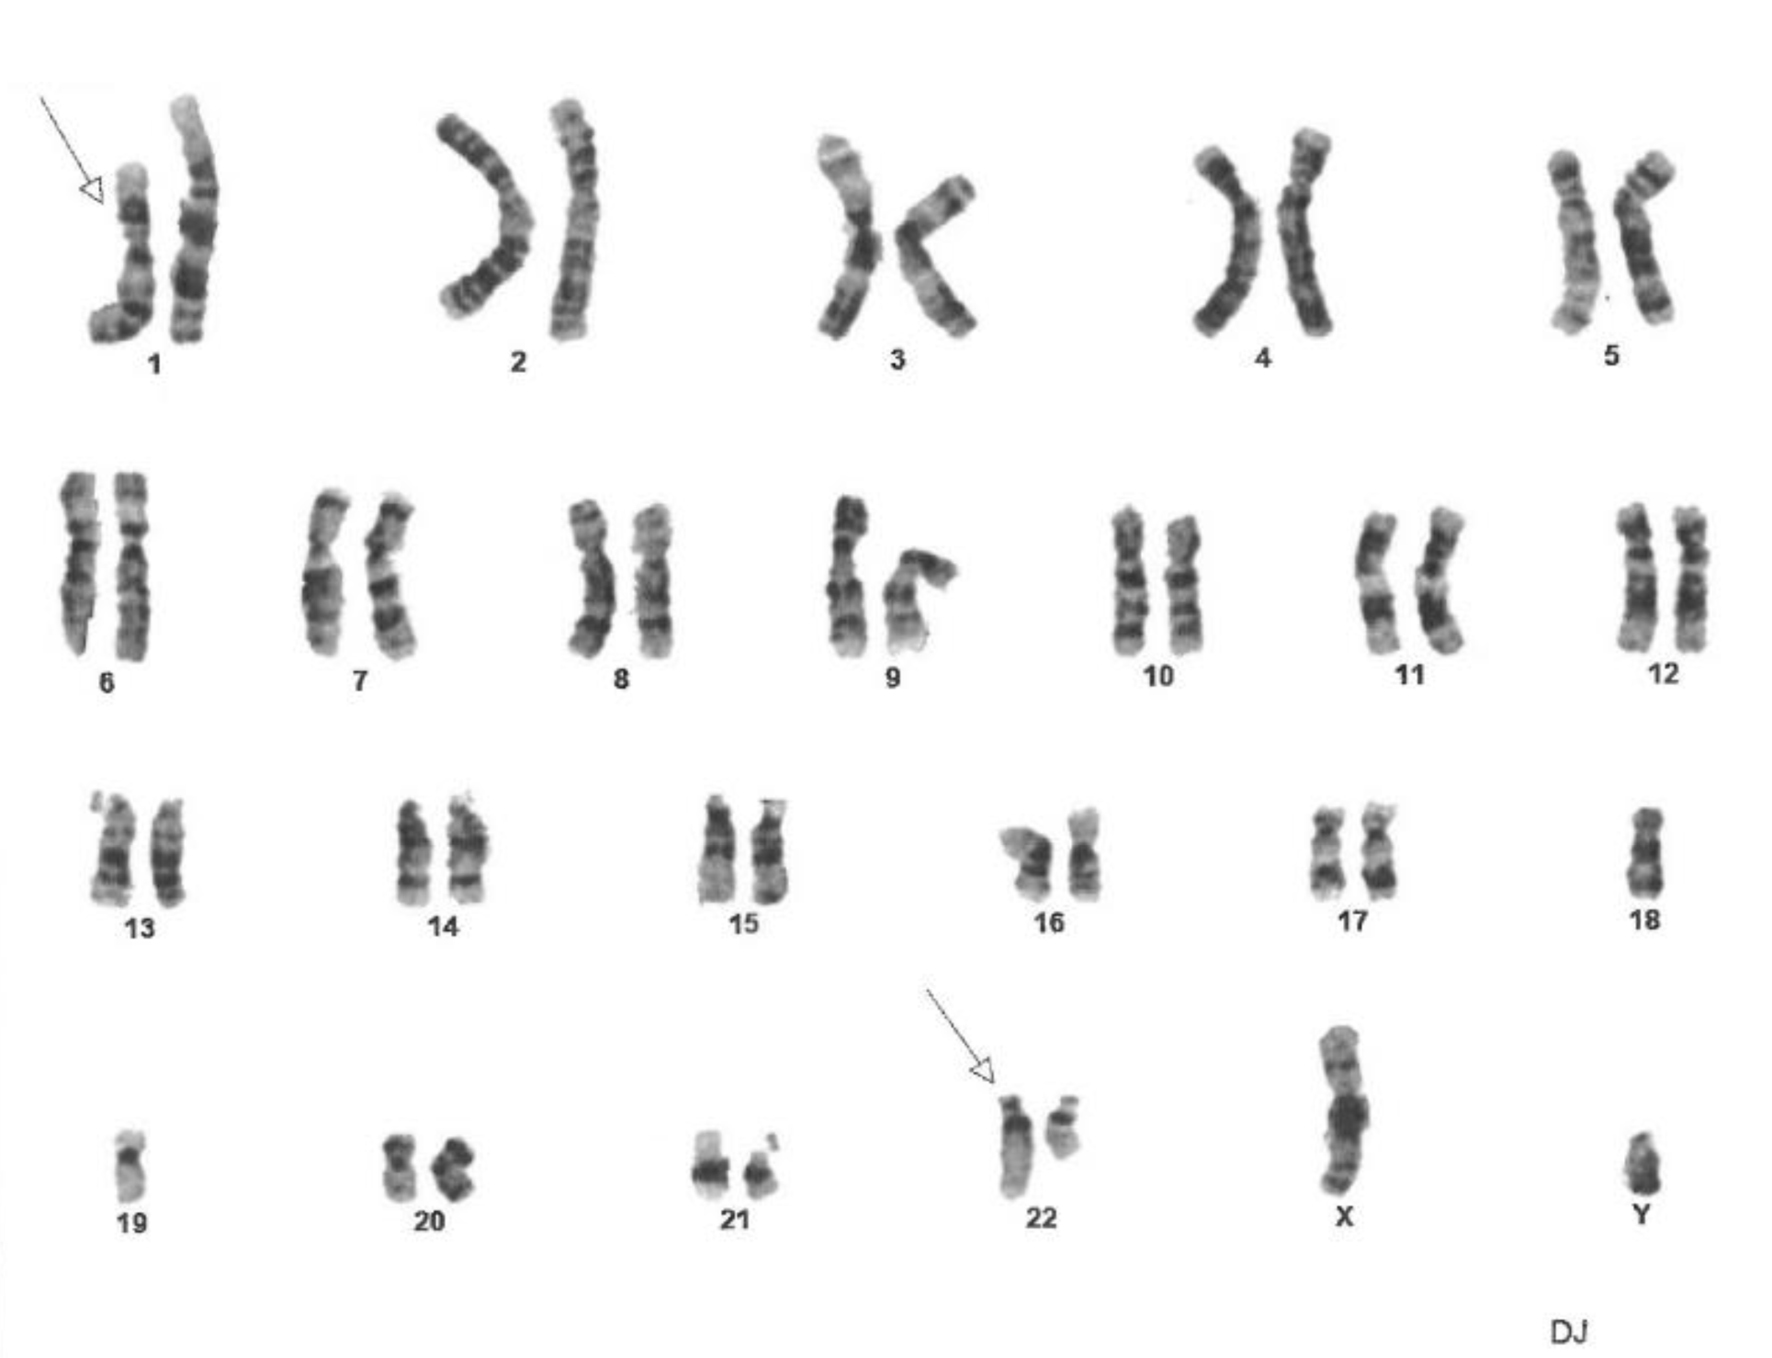
Figure 14. Fluorescence in situ hybridization (FISH) analysis of cells in metaphase showing constitutional mutation t(1;22)(p22;q11.2). The constitutional mutation was found in 100% of cells. Twenty cells in metaphase were analyzed using ASR DNA probes (Abbott Molecular Inc.) for common genetic abnormalities found in acute lymphoblastic leukemia, non-Hodgkin lymphoma and Hodgkin lymphoma. It did not detect any abnormalities on D6Nz1, MYB on chromosome 6, MYC on 8q. D13S319 and LAMP1 on 13q. IGH on 14q. and TP53 on 17p.
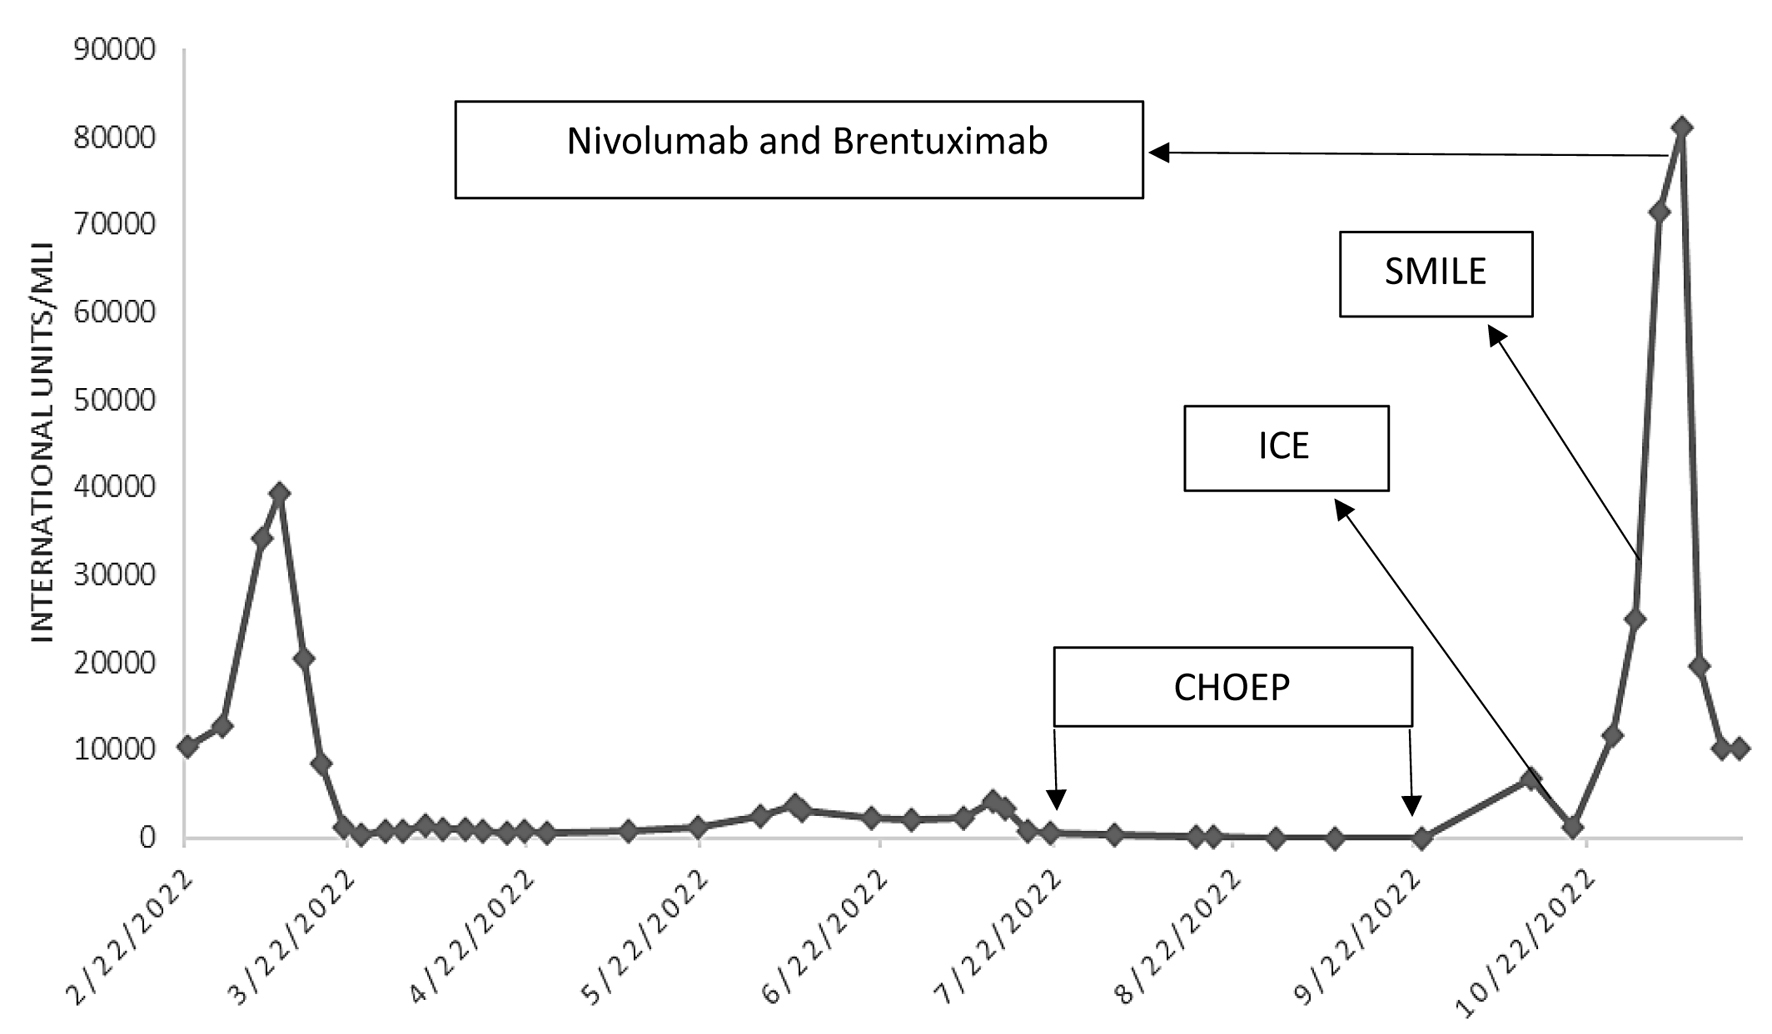
Figure 15. Epstein-Barr virus (EBV) DNA quantification via polymerase chain reaction. A line graph that charts EBV titers throughout the patient’s disease course, including the effects of chemotherapy. The arrows denote the start of chemotherapy regimen and the subsequent increase in titers indicates resistance to treatment. CHOEP: cyclophosphamide, hydroxydaunorubicin, oncovin, etoposide, prednisone; ICE: ifosfamide, carboplatin, and etoposide; SMILE: etoposide, ifosfamide, methotrexate and dexamethasone.