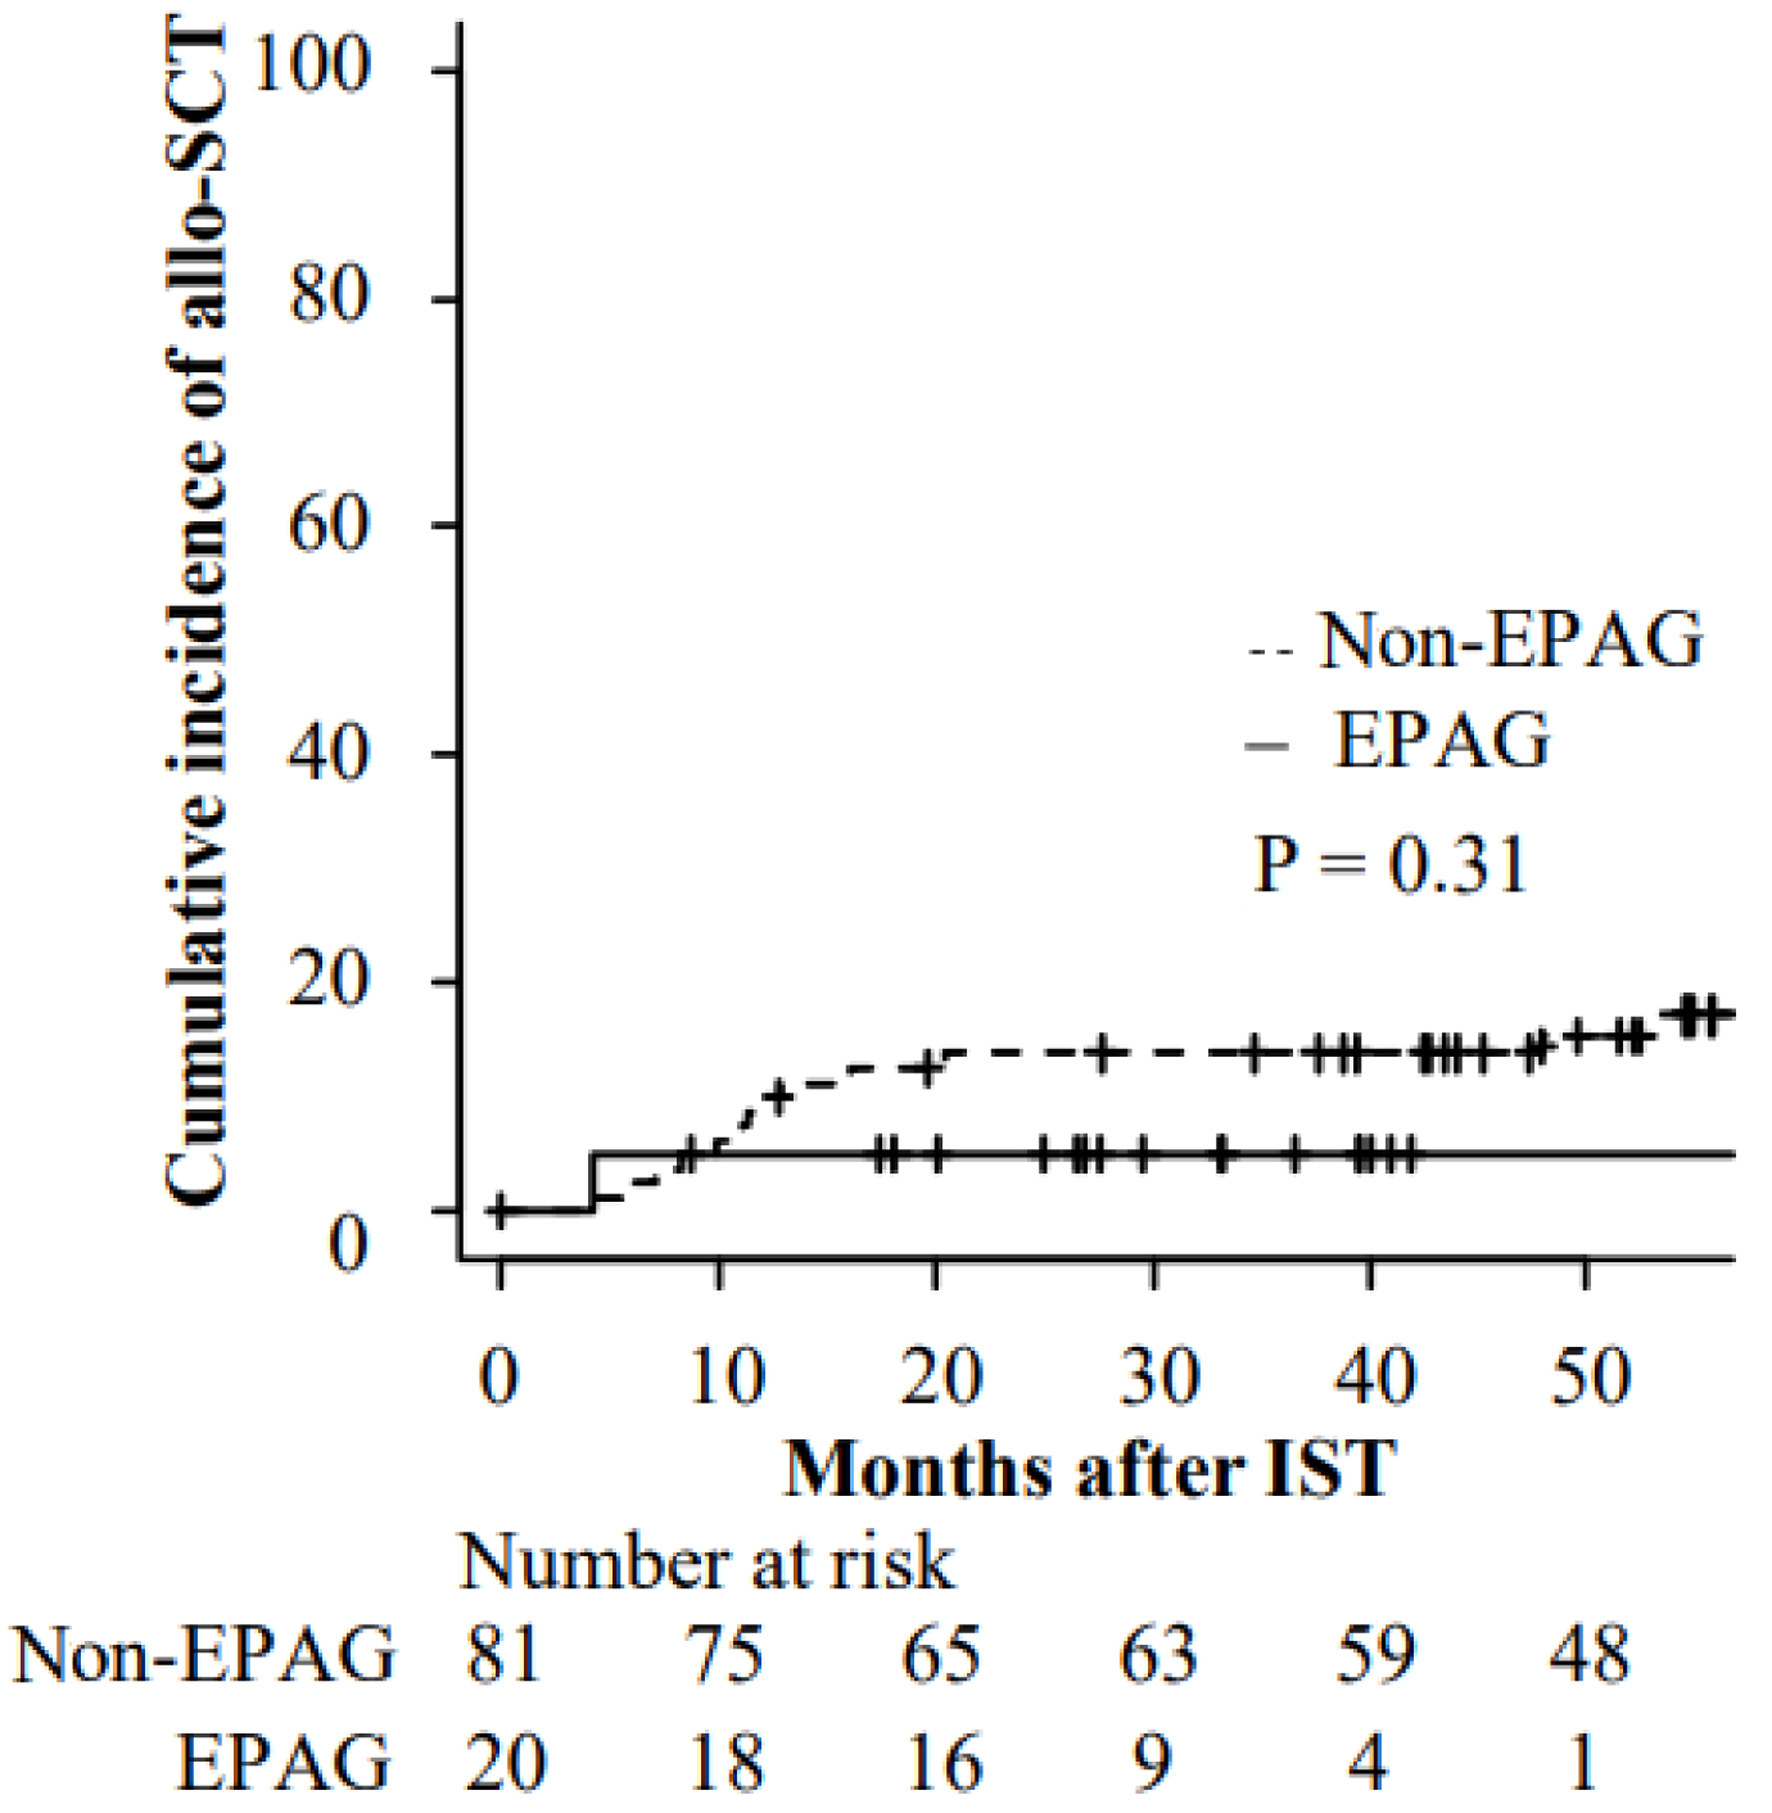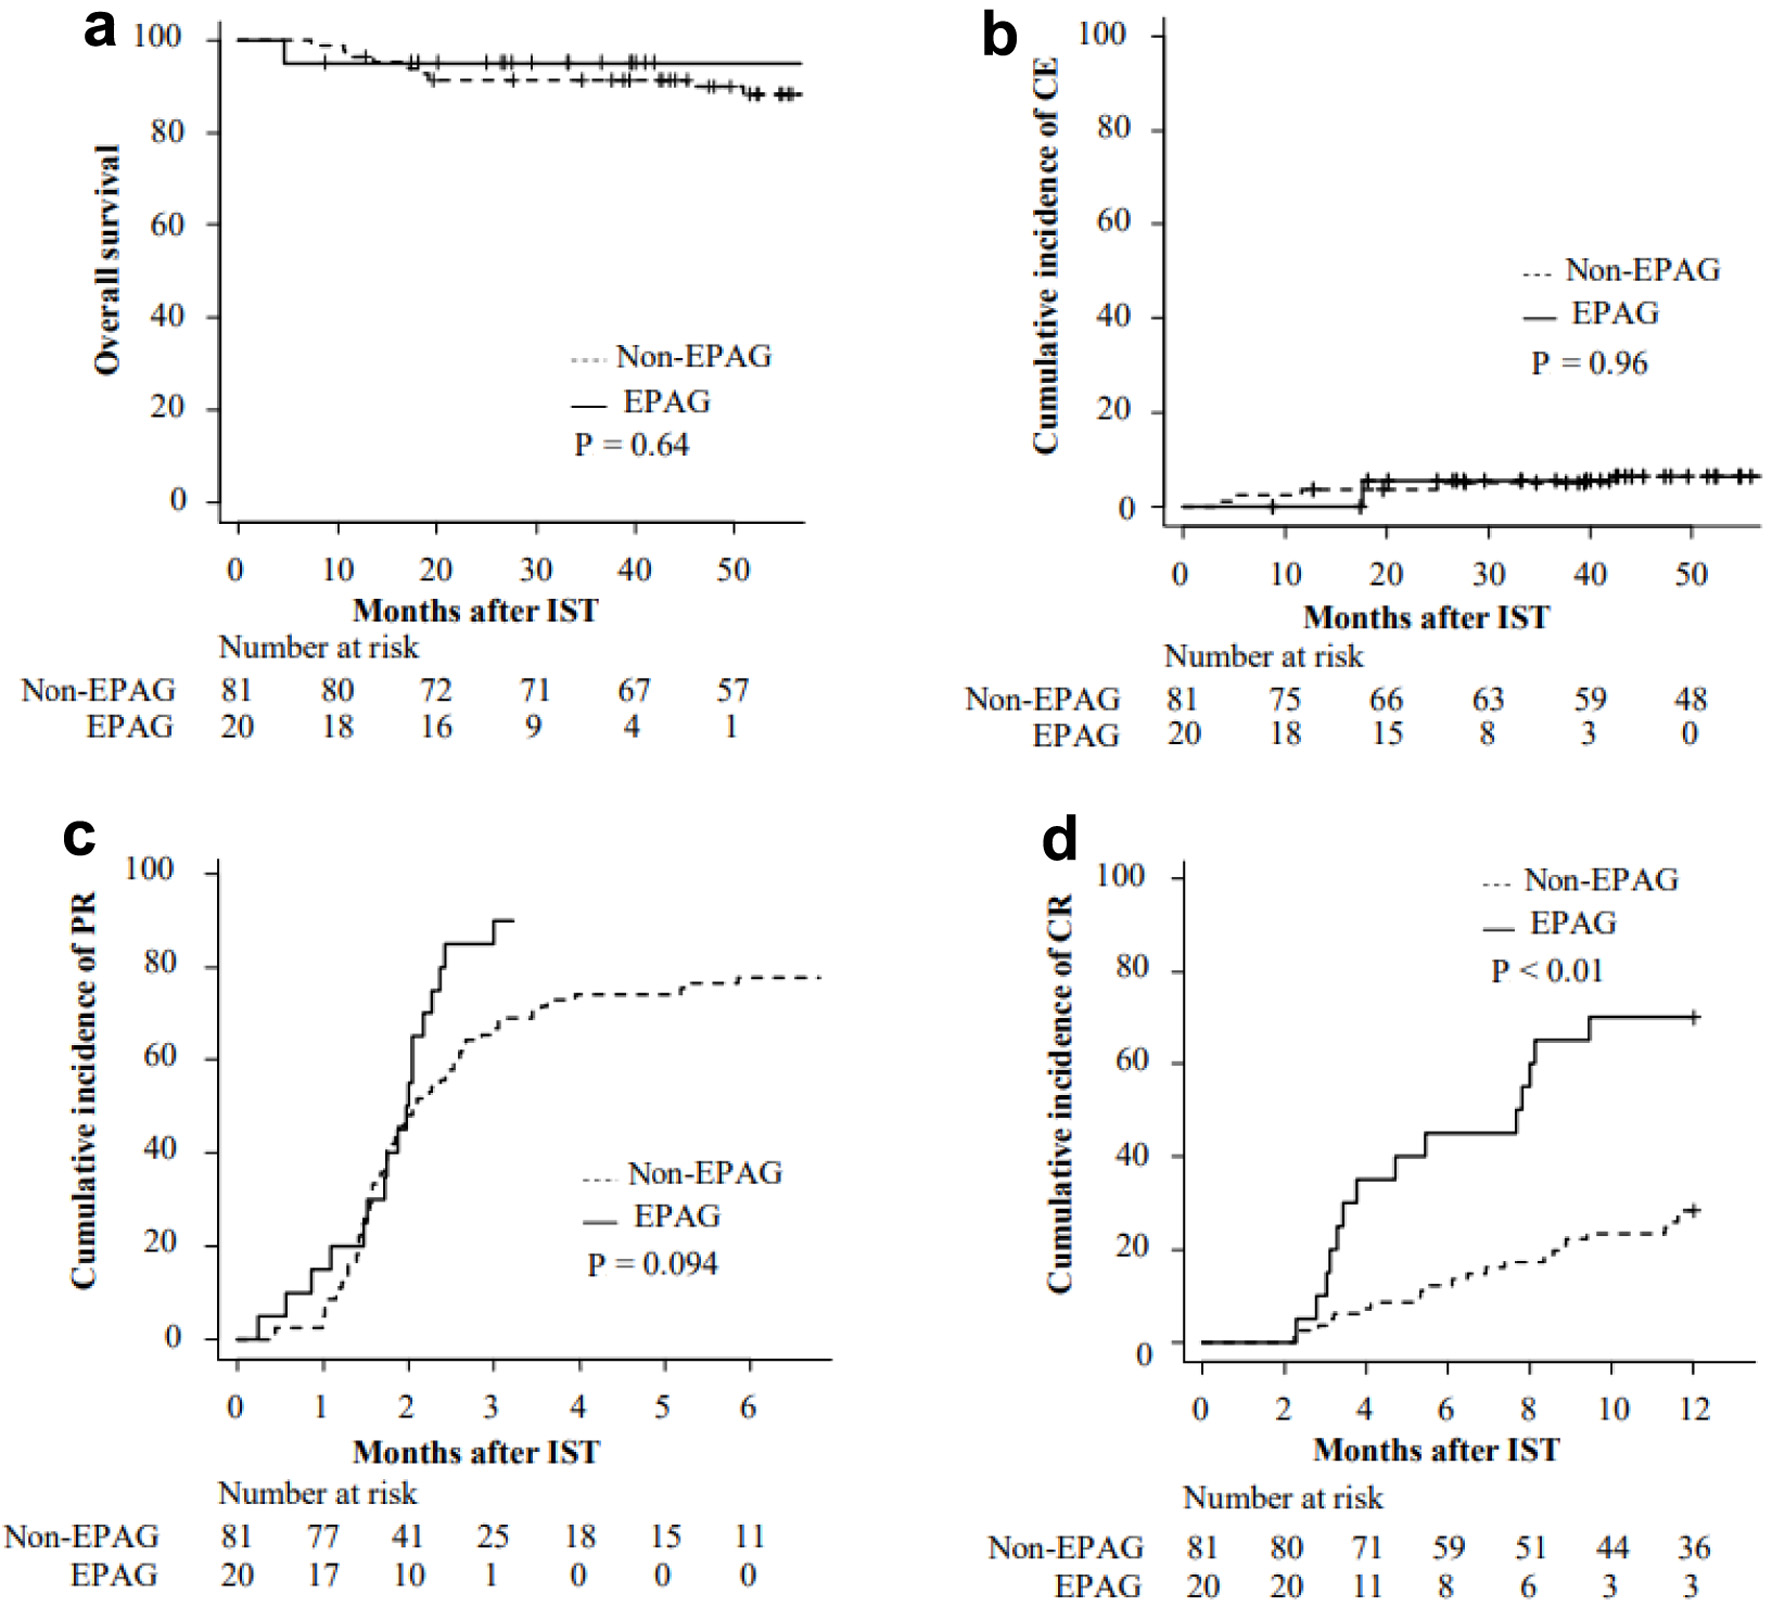
Figure 1. Cumulative incidence of allogenic stem cell transplantation after IST. allo-SCT: allogenic stem cell transplantation; EPAG: eltrombopag; IST: immunosuppressive therapy.
| Journal of Hematology, ISSN 1927-1212 print, 1927-1220 online, Open Access |
| Article copyright, the authors; Journal compilation copyright, J Hematol and Elmer Press Inc |
| Journal website https://www.thejh.org |
Original Article
Volume 13, Number 4, August 2024, pages 142-149
Long-Term Outcome of Eltrombopag With First-Line Immunosuppressive Therapy for Newly Diagnosed Severe Aplastic Anemia
Figures


Tables
| Baseline characteristics | Non-EPAG (n = 81) | EPAG (n = 20) | P |
|---|---|---|---|
| ATG: antithymocyte globulin; EPAG: eltrombopag; HLA: human leukocyte antigen. | |||
| Median age at ATG administration (range) | 52 (15 - 65) | 53 (18 - 65) | 0.78 |
| Camitta criteria, n (%) | |||
| Severe | 51 (63.0) | 10 (50.0) | 0.32 |
| Very severe | 30 (37.0) | 10 (50.0) | |
| Karyotype, n (%) | |||
| Normal | 71 (87.7) | 17 (85.0) | 0.58 |
| Others | 7 (8.6) | 3 (15.0) | |
| Missing | 3 (3.7) | 0 (0.0) | |
| Sex, n (%) | |||
| Female | 39 (48.1) | 6 (30.0) | 0.21 |
| Male | 42 (51.9) | 14 (70.0) | |
| HLA-matched sibling donor, n (%) | |||
| Identified | 14 (17.3) | 3 (15.0) | 1 |
| Median baseline blood cell count (range) | |||
| Neutrophil (/µL) | 308 (0 - 2,842) | 239.0 (45 - 928) | 0.82 |
| Platelet (× 104/µL) | 0.70 (0.10 - 4.70) | 0.85 (0.10 - 1.80) | 0.95 |
| Reticulocyte (× 104/µL) | 1.42 (0.08 - 6.06) | 1.33 (0.37 - 4.10) | 0.91 |
| Median follow-up months (range) | 64.0 (7.4 - 153.1) | 29.0 (4.6 - 60.4) | < 0.001 |
| Non-EPAG | EPAG | P | |
|---|---|---|---|
| allo-SCT: allogenic stem cell transplantation; EPAG: eltrombopag; IST: immunosuppressive therapy. | |||
| Insufficient response of IST, n (%) | 7 (8.6) | 1 (5) | 1 |
| Clonal evolution, n (%) | 4 (4.9) | 0 (0) | 0.58 |
| Relapse, n (%) | 3 (3.7) | 0 (0) | 1 |
| Variable | HR (95% CI) | P |
|---|---|---|
| allo-SCT: allogenic stem cell transplantation; CI: confidence interval; EPAG: eltrombopag; HR: hazard ratio. | ||
| Group | ||
| Non-EPAG | 1 | 0.36 |
| EPAG | 0.34 (0.032 - 3.52) | |
| Age | ||
| 16 - 49 | 1 | 0.042 |
| 50+ | 0.32 (0.11 - 0.95) | |
| Severity | ||
| Severe | 1 | 0.71 |
| Very severe | 1.22 (0.43 - 3.47) | |
| Sibling donor | ||
| Not identified | 1 | < 0.01 |
| Identified | 6.14 (2.03 - 18.58) | |
| Age | Sex | Group | Diagnosis | Karyotype before IST | Karyotype at CE | Months from IST to CE |
|---|---|---|---|---|---|---|
| AML: acute myeloid leukemia; CE: clonal evolution; CHIP: clonal hematopoiesis of indeterminate potential; EPAG: eltrombopag; F: female; IST: immunosuppressive therapy; M: male; MDS: myelodysplastic syndrome. | ||||||
| 37 | F | Non-EPAG | MDS | 46, XX [20] | 46, XX [20] | 3.7 |
| 54 | M | Non-EPAG | AML | Missing | 46, XX, add(7)(q22) [20] | 5.0 |
| 38 | M | Non-EPAG | MDS | 46, Y, ?t(X; 6)(q26; q21) [1]/46, XY [12] | 46, Y, t(X; 11)(q28; p11. 2) [7]/46, XY [13] | 11.7 |
| 58 | F | EPAG | CHIP | 46, XX [20] | 46, XX, del(6)(q?) [4]/46, XX [16] | 17.9 |
| 54 | F | Non-EPAG | CHIP | 46, XX [20] | 47, XX, +21 | 25.3 |
| 62 | M | Non-EPAG | MDS | 45,X,-Y [3]/46, XY [17] | 45, X,-Y [16]/45,idem,?t(7;8)(q32;q22) [1]/46, XY [3] | 42.3 |
| 46 | M | Non-EPAG | MDS | 46, XY [20] | 46, XY, +1, der(1; 7)(q10; p10) [4]/46, XY [16] | 67.7 |
| 62 | F | Non-EPAG | MDS | 46, XX [20] | 44, XX, add(2)(p11.2), -9, add(15)(q15), -18, add(21)(q22.1) [12]/45, idem, -add(21), +add(21)(q22.1)x2 [3]/46, XX [1] | 114.1 |
| Non-EPAG (n = 81), n (%) | EPAG (n = 20), n (%) | P | |
|---|---|---|---|
| EBV: Epstein-Barr virus; EPAG: eltrombopag; IST: immunosuppressive therapy. | |||
| EBV reactivation | 2 (2.5) | 0 (0.0) | 1 |
| Kidney dysfunction | 7 (8.6) | 0 (0.0) | 0.34 |
| Liver dysfunction | 11 (13.6) | 1 (5.0) | 0.45 |
| Infection | 33 (40.7) | 4 (20.0) | 0.12 |
| Febrile neutropenia | 27 (33.3) | 2 (10.0) | 0.052 |