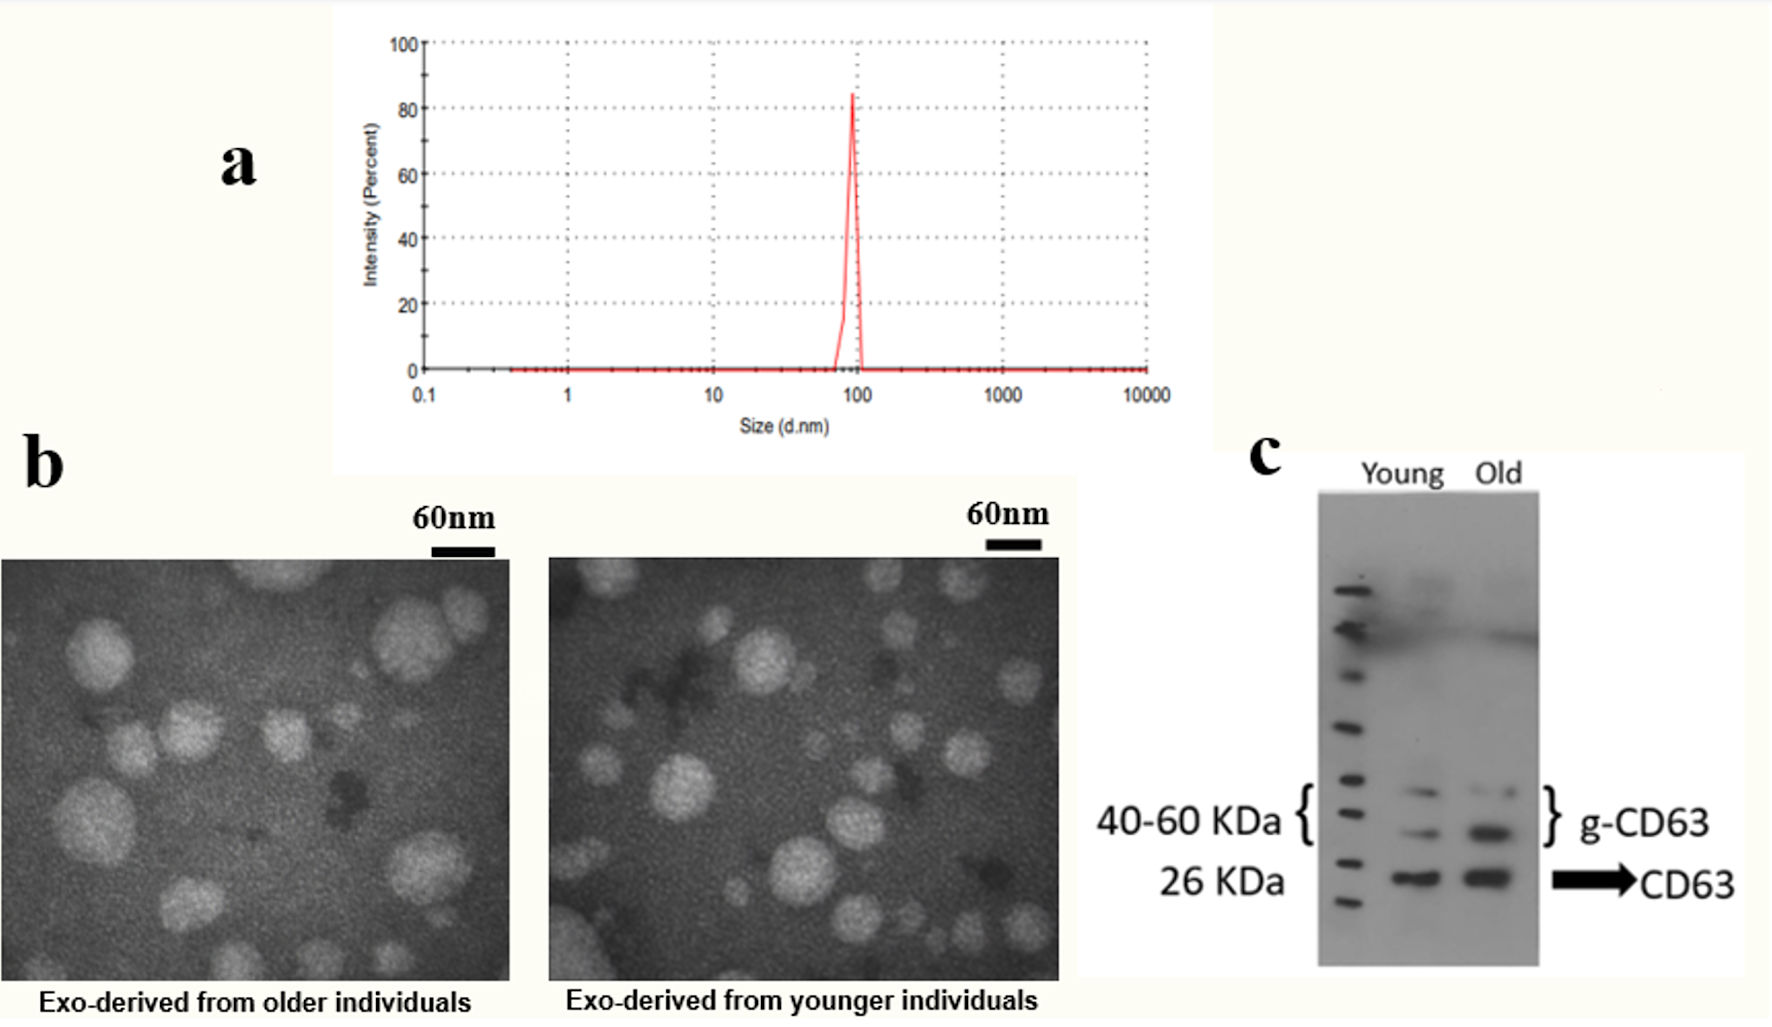
Figure 1. Determining the characteristics of exosomes. Isolated exosomes were evaluated in size, zeta potential, morphology, and CD63 protein expression. (a) Determination of the characteristics of exosomes by DLS. (b) Evaluation of the size and morphology of exosomes by TEM. (c) Confirmation of the expression of the specific CD63 marker by Western blot. DLS: dynamic light scattering; TEM: transmission electron microscopy.

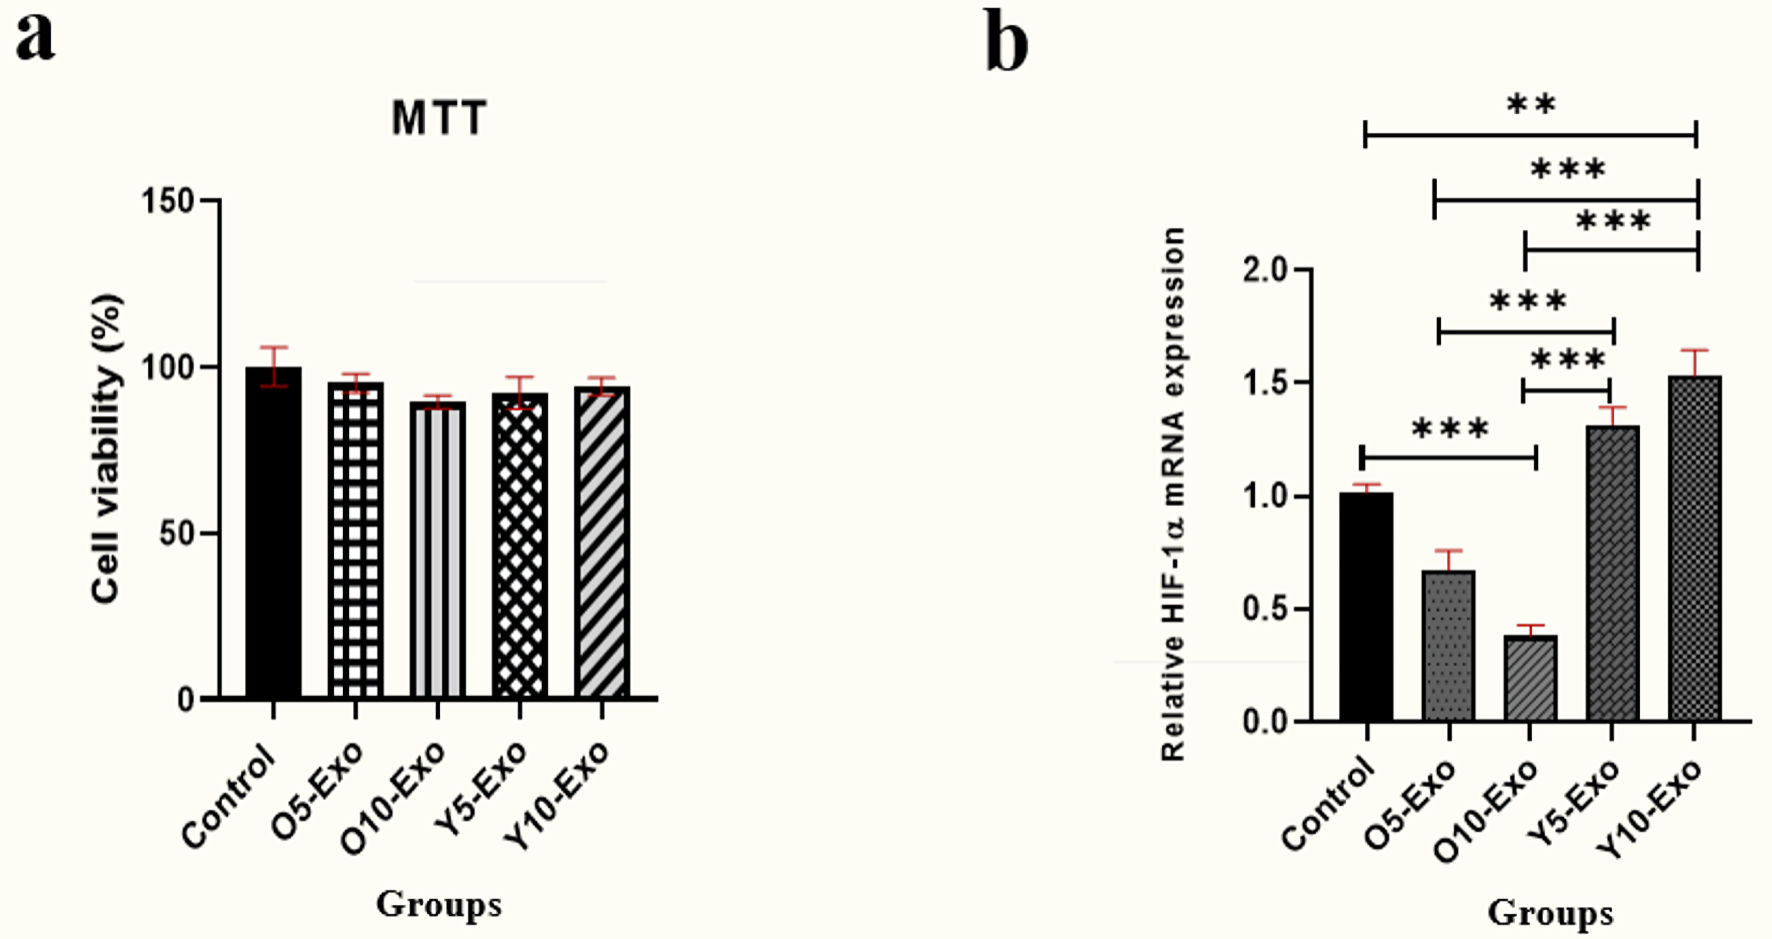
Figure 2. (a) MTT colorimetric assay for measuring the viability of hematopoietic stem cells (HSCs) after treatment with 5 µg/mL and 10 µg/mL concentration of exosomes isolated from young and old individuals. (b) The HIF-1α mRNA expression in the HSCs treated with the doses of 5 and 10 µg/mL Older-Exo (O5-Exo, O10-Exo) and Younger-Exo (Y5-Exo, Y10-Exo). O5-Exo: 5 µg/mL concentration of exosomes isolated from older individuals; O10-Exo: 10 µg/mL concentration of exosomes isolated from older individuals; Y5-Exo: 5 µg/mL concentration of exosomes isolated from younger individuals; Y10-Exo: 10 µg/mL concentration of exosomes isolated from younger individuals; MTT: 3-(4,5-dimethylthiazol-2-yl)-2,5-diphenyl tetrazolium bromide; HIF-1α: hypoxia-inducible factor 1α.

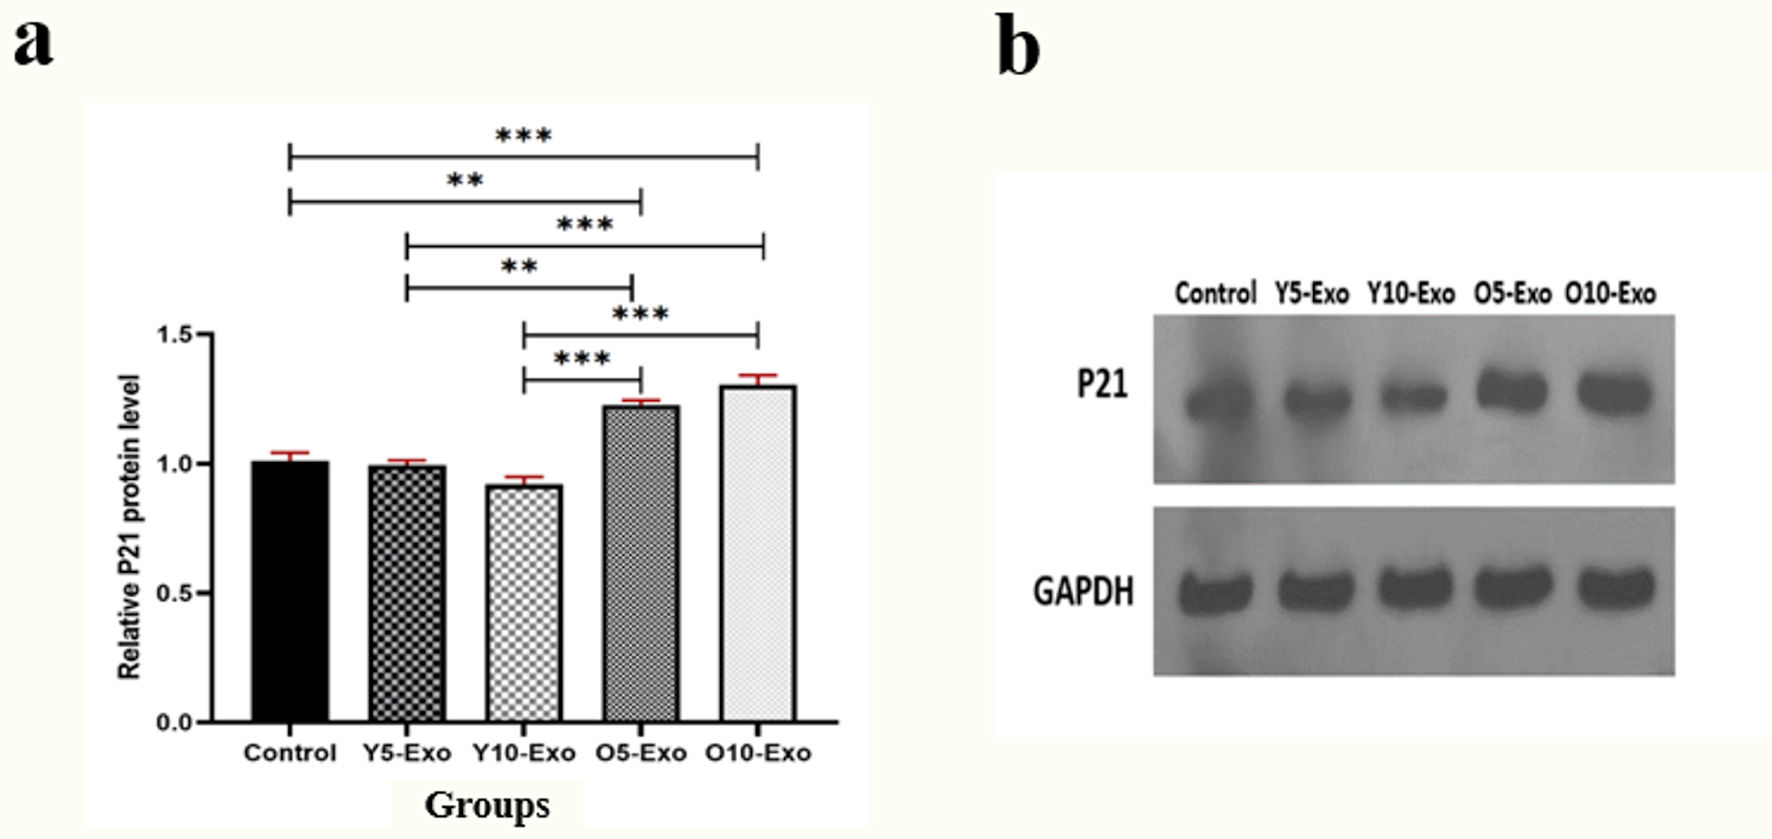
Figure 3. (a) The relative P21 protein level, based on P21/GAPDH ratio, in hematopoietic stem cells (HSCs) treated with the doses of 5 and 10 µg/mL Older-Exo (O5-Exo, O10-Exo) and Younger-Exo (Y5-Exo, Y10-Exo). (b) The levels of P21 protein and GAPDH evaluated by the Western blotting test. O5-Exo: 5 µg/mL concentration of exosomes isolated from older individuals; O10-Exo: 10 µg/mL concentration of exosomes isolated from older individuals; Y5-Exo: 5 µg/mL concentration of exosomes isolated from younger individuals; Y10-Exo: 10 µg/mL concentration of exosomes isolated from younger individuals; GAPDH: glyceraldehyde 3-phosphate dehydrogenase.


