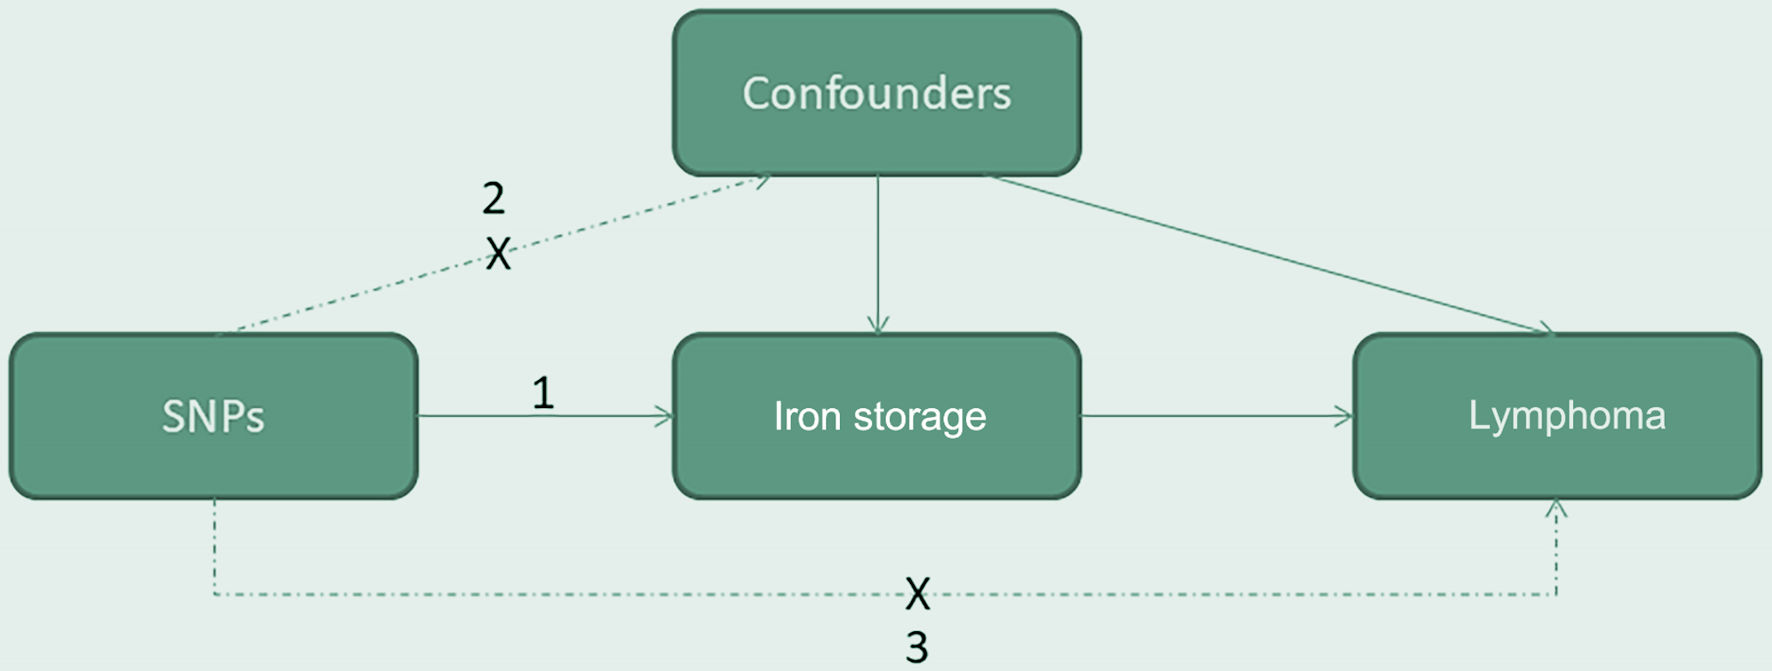
Figure 1. The causal directed acyclic graph of the two-sample mendelian randomization study. Our study was predicated on three core assumptions: 1) the genetic instrumental variables are robustly associated with iron storage; 2) these genetic variants are independent of potential confounders; and 3) the effect of the genetic variants on lymphoma risk is exclusively mediated through iron storage. SNP: single nucleotide polymorphism.
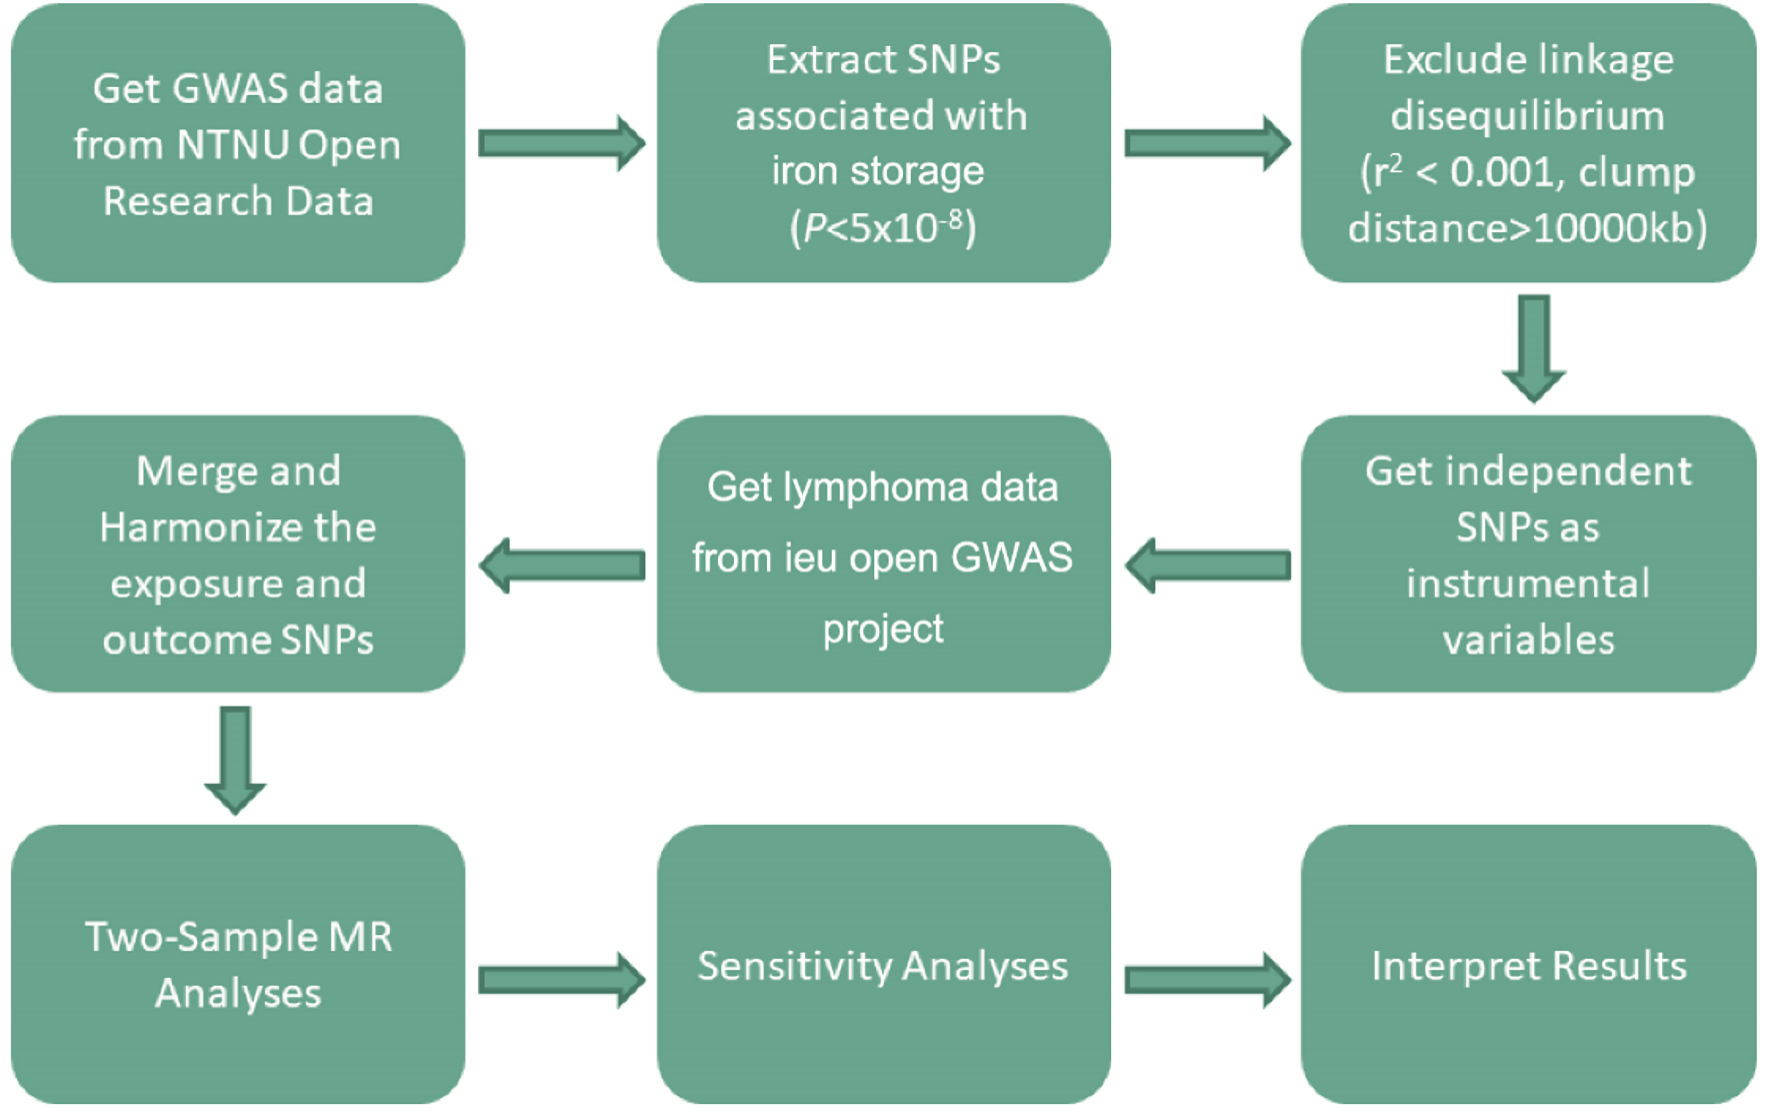
Figure 2. MR study flowchart. The boxes represent research steps, and the arrows indicate the flow direction. GWAS: genome-wide association study; MR: mendelian randomization; SNP: single nucleotide polymorphism.
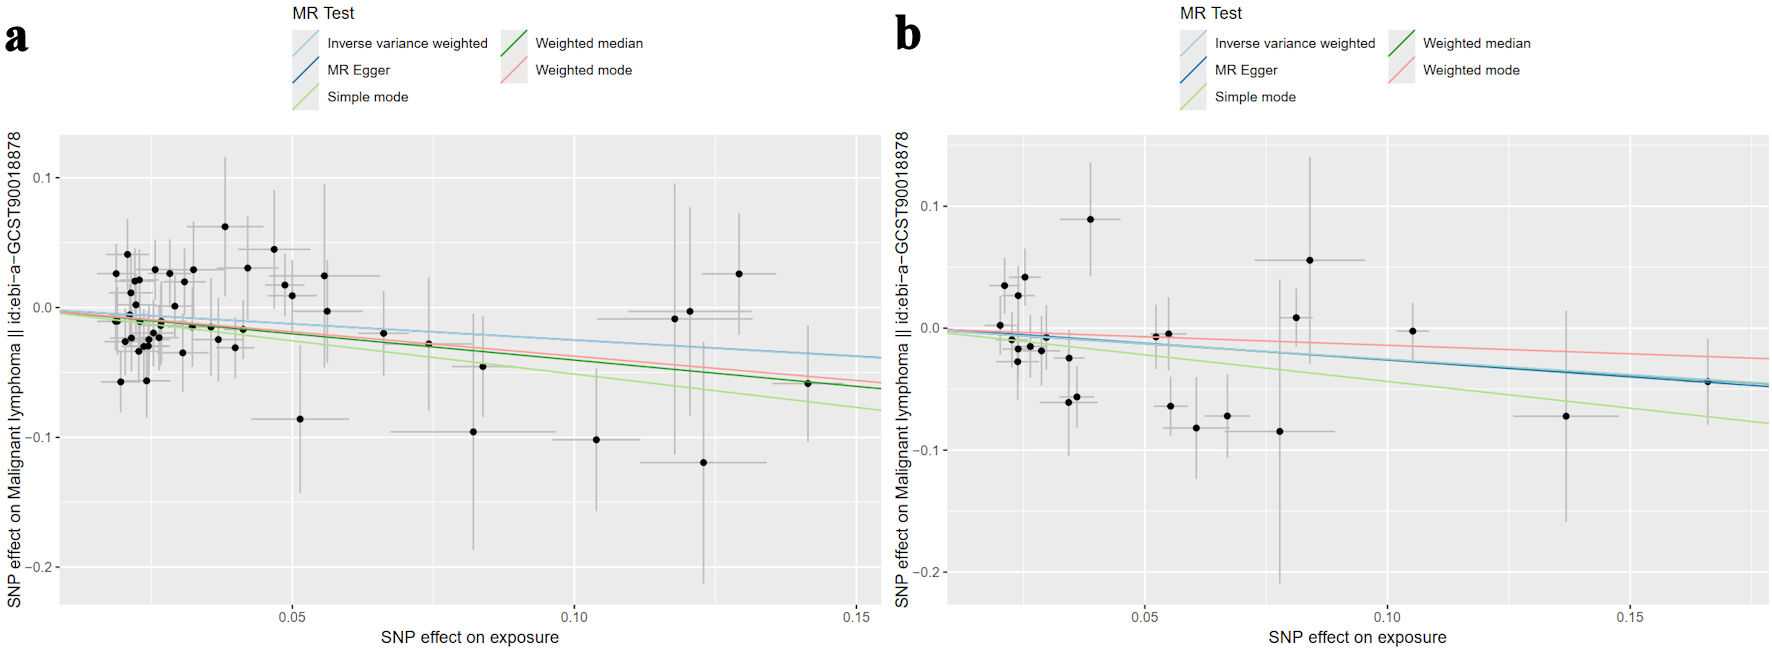
Figure 3. Scatter plots illustrate the causal relationship between genetically predicted iron storage and lymphoma risk using four MR methods. Each data point corresponds to an instrumental variable (IV), with its horizontal position indicating the SNP effect on iron storage - either (a) ferritin or (b) serum iron. The vertical position reflects the SNP effect on lymphoma risk. Lines connecting the SNP effects for each MR method (inverse variance-weighted (light blue), MR-Egger (dark blue), simple mode (light green), weighted median (dark green), and weighted mode (pink)) visualize the causal estimate. A negative slope of the line suggests an inverse association between iron status and lymphoma risk. Ferritin exhibited an odds ratio of 0.777 (95% CI: 0.628 - 0.961, P = 0.020), and serum iron demonstrated an odds ratio of 0.776 (95% CI: 0.609 - 0.989, P = 0.040). MR: mendelian randomization; SNP: single-nucleotide polymorphism; CI: confidence interval.
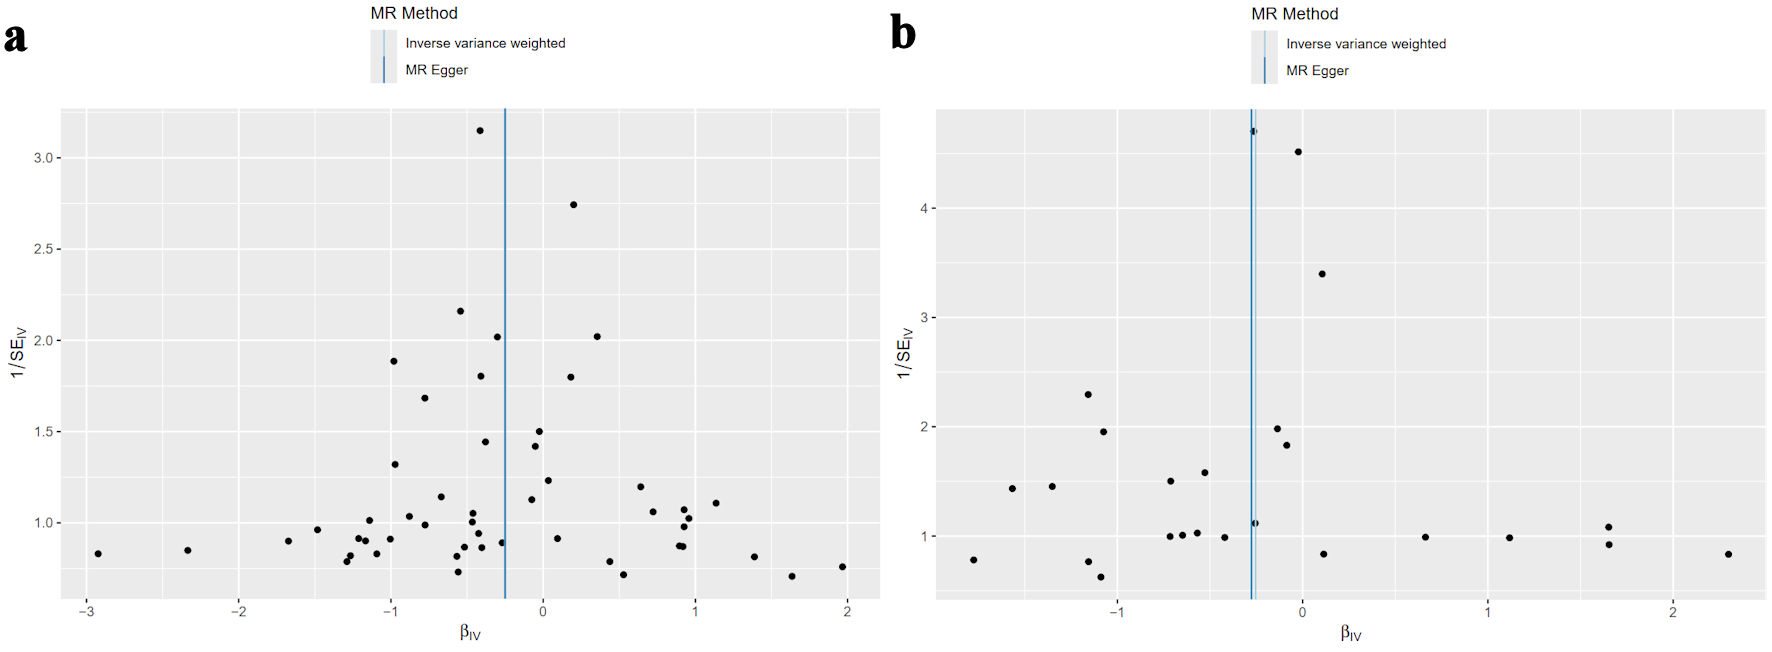
Figure 4. The MR-heterogeneity assay found no significant heterogeneity for ferritin (P = 0.732) or serum iron (P = 0.092). The funnel plots of the causality of iron storage and lymphoma were symmetrically distributed for (a) ferritin, and (b) serum iron. MR: mendelian randomization.
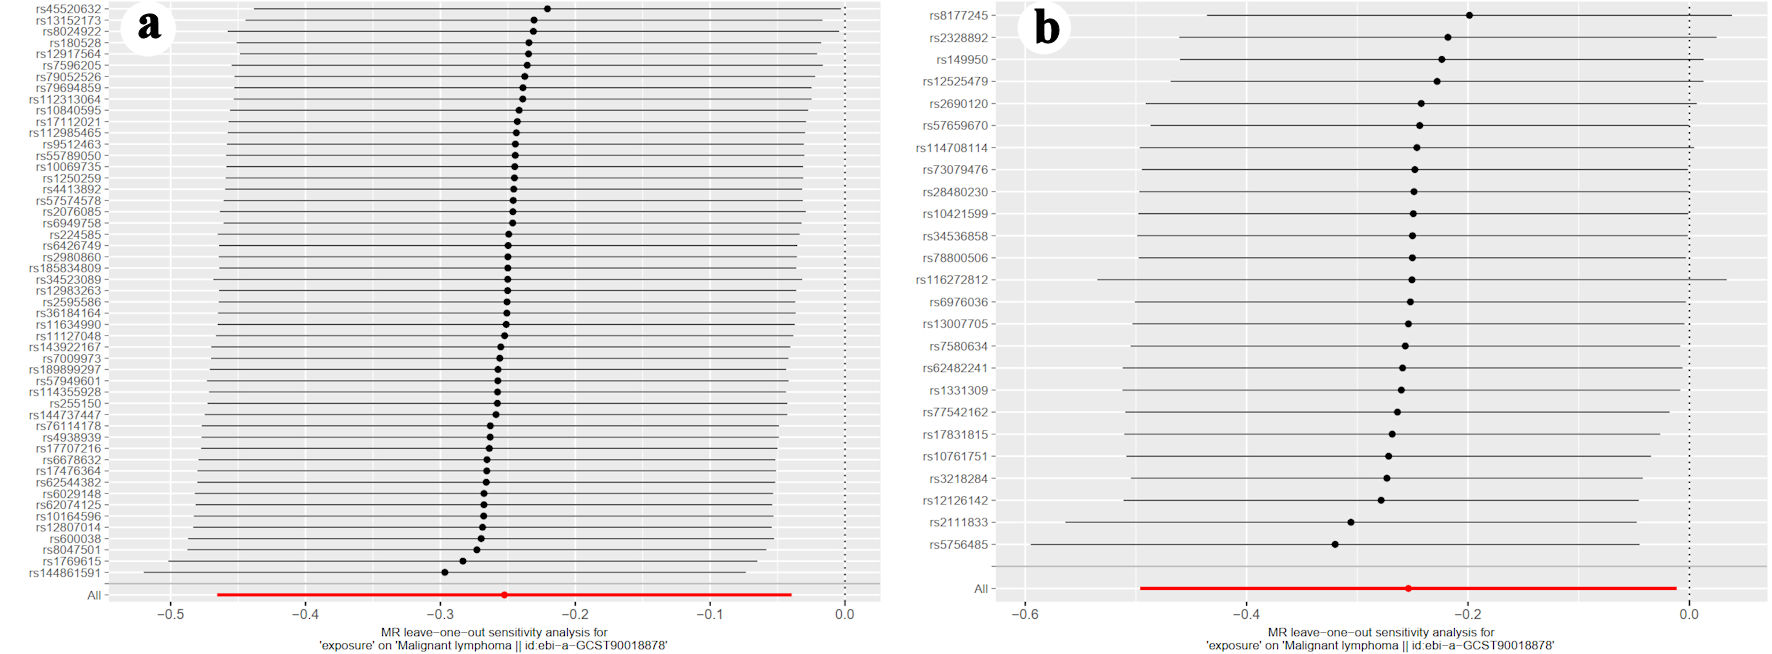
Figure 5. The leave-one-out graph indicated that removal of any SNPs had no fundamental effect on the results, suggesting that the MR results were reliable for (a) ferritin, and (b) serum iron. MR-Egger intercept analysis detected no evidence of pleiotropic effects for ferritin (P = 0.987) or serum iron (P = 0.900). SNP: single-nucleotide polymorphism; MR: mendelian randomization.