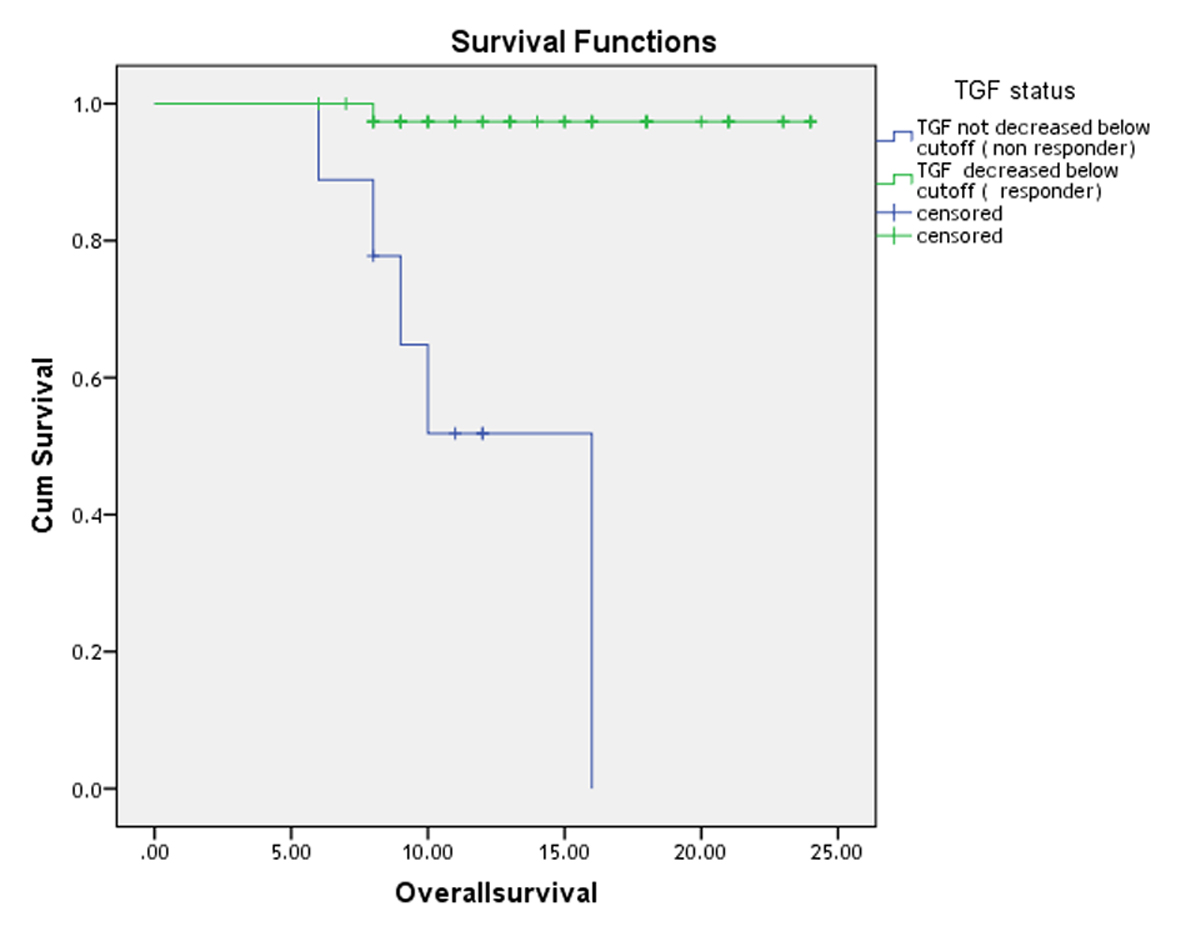
Figure 1. Two-year overall survival curve of patients with diffuse large cell non-Hodgkin lymphoma.
| Journal of Hematology, ISSN 1927-1212 print, 1927-1220 online, Open Access |
| Article copyright, the authors; Journal compilation copyright, J Hematol and Elmer Press Inc |
| Journal website http://www.thejh.org |
Original Article
Volume 4, Number 1, March 2015, pages 131-136
Prognostic Utility of Transforming Growth Factor Beta-1 in Diffuse Large Cell Non-Hodgkin Lymphoma
Figures
Tables
| Variables | No. | Percentage % |
|---|---|---|
| Age (18 - 60 years) (mean ± SD: 44.5 ± 10.7 years) | 50 | 100% |
| Sex | ||
| Male | 32 | 64% |
| Female | 18 | 36% |
| Clinical stage | ||
| I, II | 23 | 46% |
| III, IV | 27 | 54% |
| Performance status | ||
| ≥ 2 | 11 | 22% |
| International prognostic index | ||
| Low risk | 17 | 34% |
| Intermediate low risk | 13 | 26% |
| Intermediate high risk | 11 | 22% |
| High risk | 9 | 18% |
| Extra nodal sites | ||
| ≤ 1 | 38 | 76% |
| > 1 | 12 | 25% |
| Clinical presentation | ||
| Lymphadenopathy | 39 | 68% |
| Splenomegaly | 26 | 52% |
| Hepatomegaly | 18 | 36% |
| Anemia | 23 | 46% |
| B symptoms | 24 | 48% |
| Laboratory investigation | ||
| LDH | ||
| Normal | 14 | 28% |
| Elevated | 36 | 72% |
| Uric acid | ||
| Normal | 34 | 68% |
| Elevated | 16 | 32% |
| TGF-β1 | ||
| Before treatment (mean ± SD: 14.7 ± 6.) | 50 | 100% |
| After treatment (mean ± SD: 6.3 ± 5.8) | 50 | 100% |
| Hepatitis markers | ||
| HCV | 12 | 24% |
| HBV | 1 | 2% |
| HCV + HBV | 3 | 6% |
| Response | ||
| Complete response (CR) | 42 | 84% |
| Partial response (PR) | 4 | 8% |
| No response (NR) | 4 | 8% |
| Variables | Transforming growth factor beta-1 | |
|---|---|---|
| r | P value | |
| IPI: international prognostic index. | ||
| Clinical stage | +0.6* | 0.008 |
| Bulky disease | +0.8* | 0.006 |
| Patient response | +0.2* | 0.03 |
| IPI | +0.3* | 0.04 |
| Variable | Disease free survival | Overall survival | ||||
|---|---|---|---|---|---|---|
| P value | HR | 95% CI | P value | HR | 95% CI | |
| CI: confidence interval; PFS: progression-free survival; HR: hazard ratio; OS: overall survival. | ||||||
| Age | 0.57 | 0.8 | 0.4 - 1.7 | 0.83 | 0.9 | 0.2 - 1.7 |
| Performance status ≥ 2 | 0.03 | 3.4 | 1.1 | 0.75 | 0.8 | 0.3 - 2.4 |
| Elevated LDH | 0.86 | 0.1 | 0.5 - 2.4 | 0.73 | 0.8 | 0.3 - 2.5 |
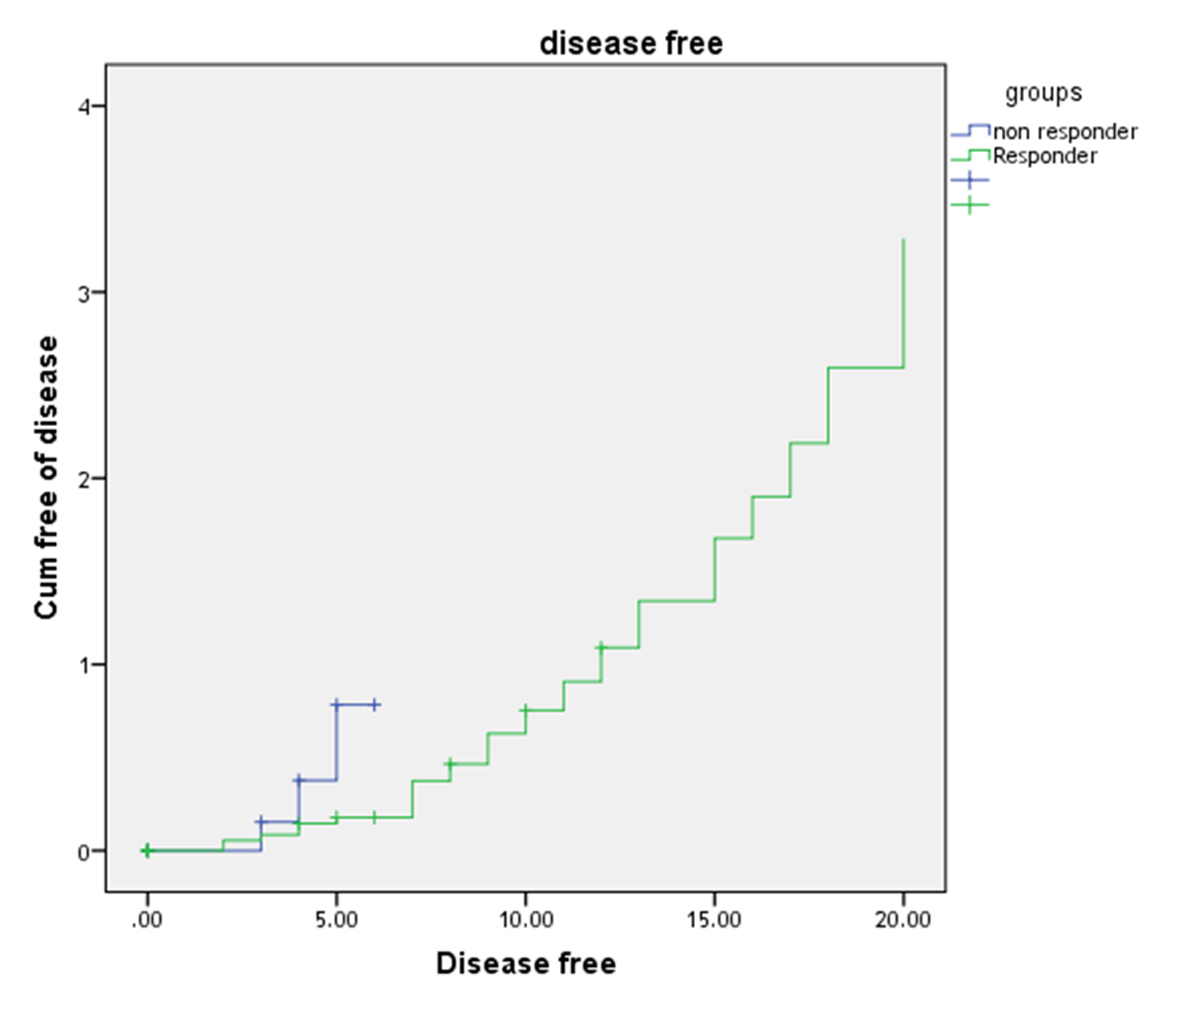
| TGF-β1 | 0.007 | 3.5 | 1.4 - 8.9 | 0.003 | 5.8 | 1.8 - 18.8 |
| B symptoms | 0.53 | 0.7 | 0.2 - 2.2 | 0.13 | 0.2 | 0.02 - 1.6 |
| Clinical stage | 0.43 | 1.4 | 0.6 - 3.3 | 0.27 | 1.9 | 0.6 6.3 |
| Bulky disease | 0.008 | 3.7 | 1.5 - 9.1 | 0.004 | 5.9 | 1.9 - 8.9 |