Journal of Hematology, ISSN 1927-1212 print, 1927-1220 online, Open Access
Article copyright, the authors; Journal compilation copyright, J Hematol and Elmer Press Inc
Journal website http://www.thejh.org

Original Article

Volume 5, Number 2, June 2016, pages 54-59


Monoclonal B-Cell Lymphocytosis Among Egyptian Elderly Healthy Adults

Figures

Figure 1.
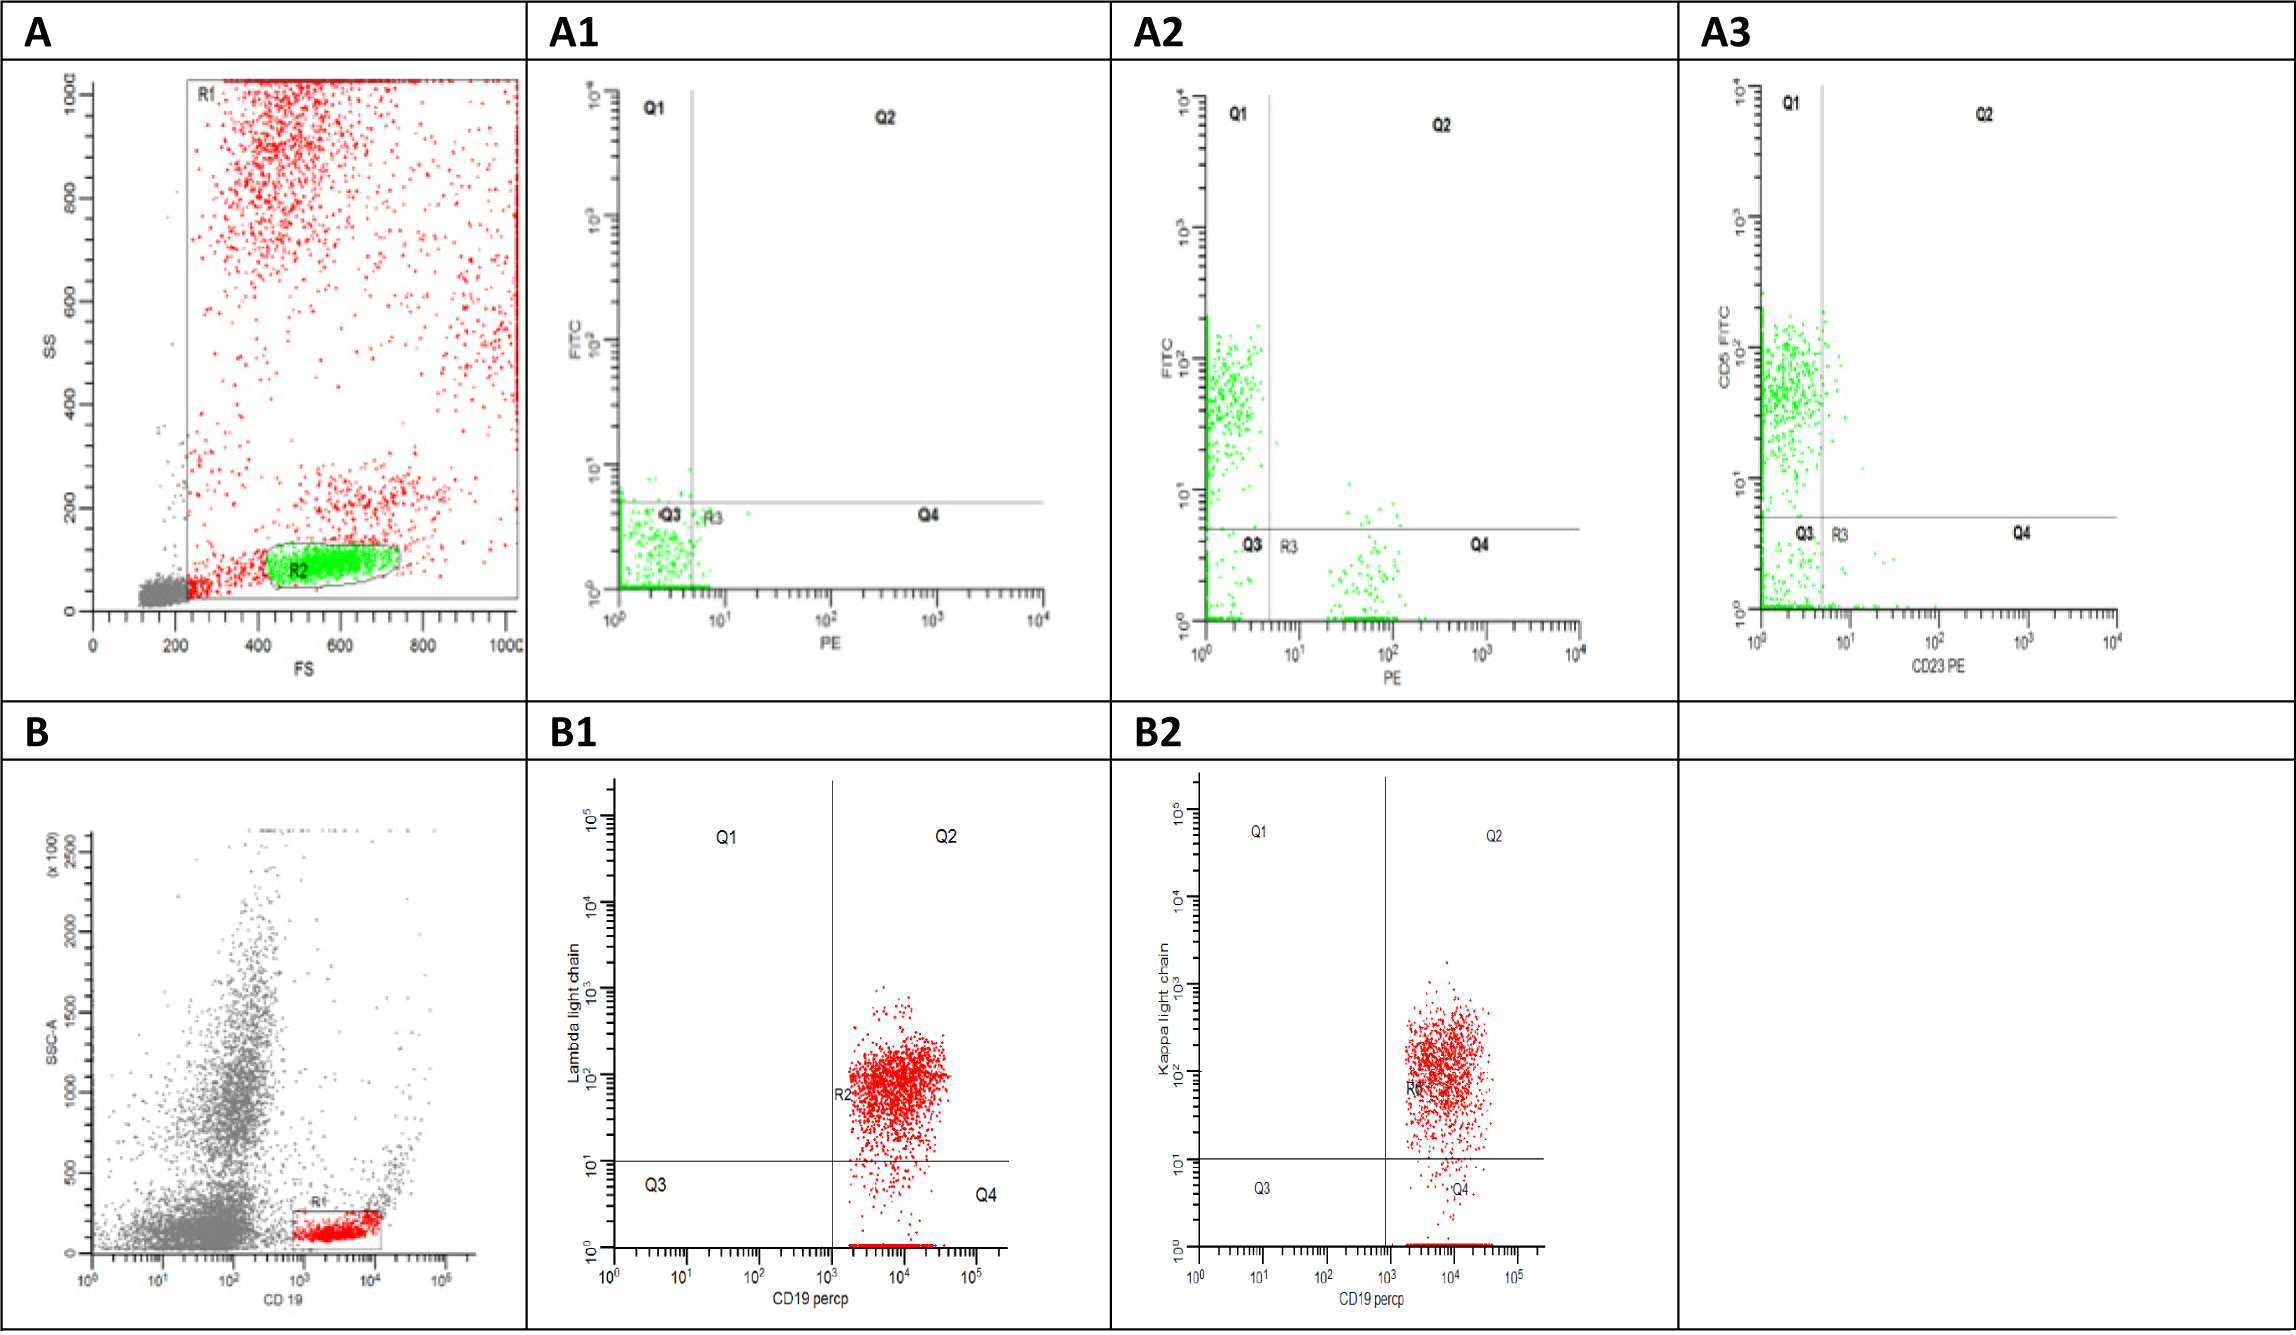
Figure 1. (A) Flowcytometry dot plot shows side scatter area versus forward scatter area, the red gate (R1) shows all the acquired cells excluding the debris in grey color and the green gate represent the lymphocytes gate. (A1) Flowcytometry dot plot shows the auto fluorescence at FITC and PE. (A2) Flowcytometry dot plot shows CD5 FITC versus CD19 PE. (A3) Flowcytometry dot plot shows CD5 FITC versus CD23 PE. (B) Flowcytometry dot plot shows side scatter area versus CD19 Percp. (B1) Flowcytometry dot plot shows Kappa FITC versus CD19 Percp. (B2) Flowcytometry dot plot shows lambda light chain PE versus CD19 Percp.
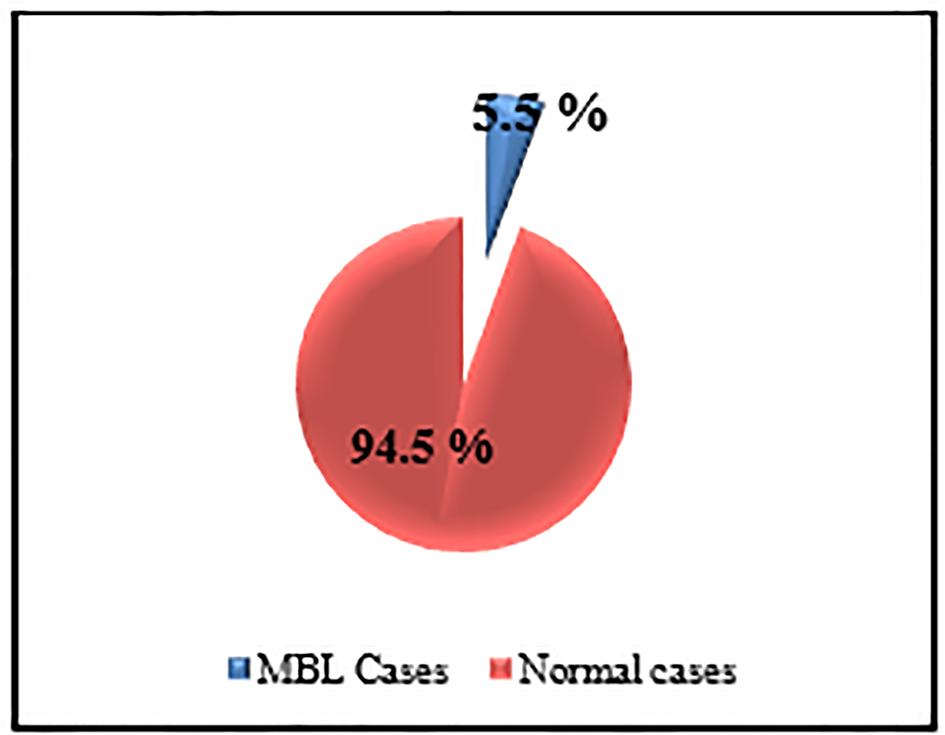
Figure 2.
Figure 2. The prevalence of MBL among studied sample.
Figure 3.
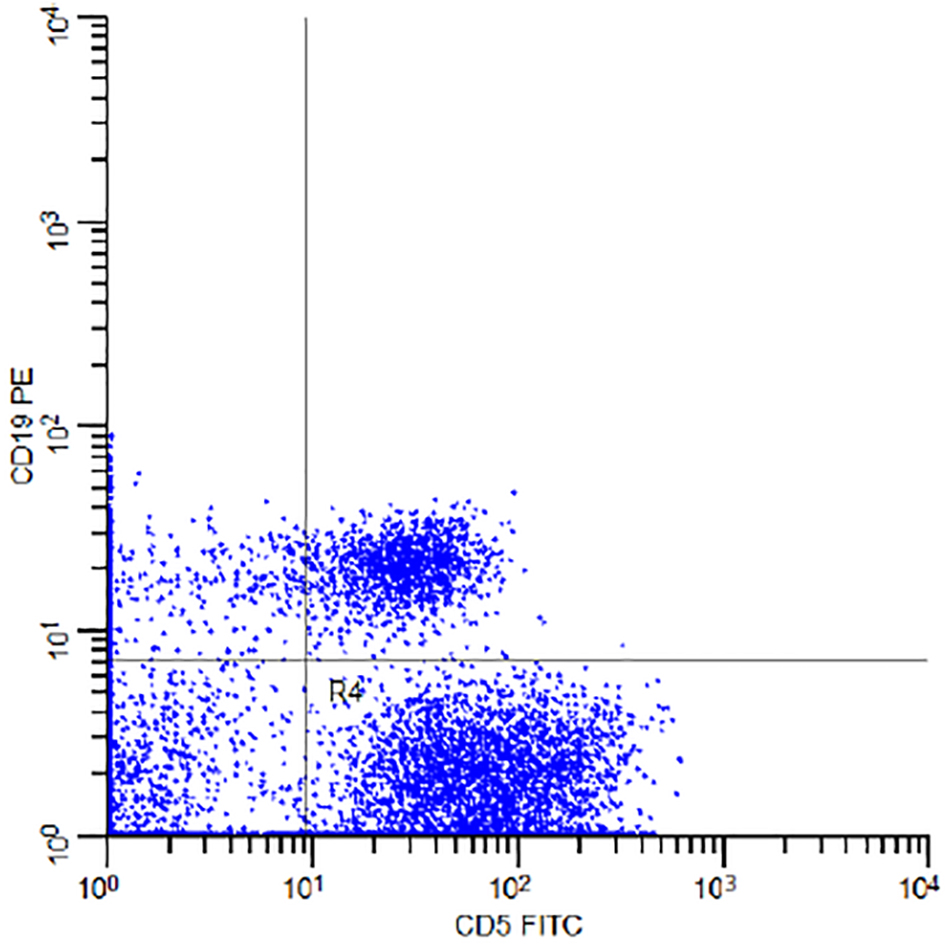
Figure 3. Flow cytometry dot plot of the subject number 11 in Table 1 demonstrating CD5 FITC and CD19 PE co-expression.
Figure 4.
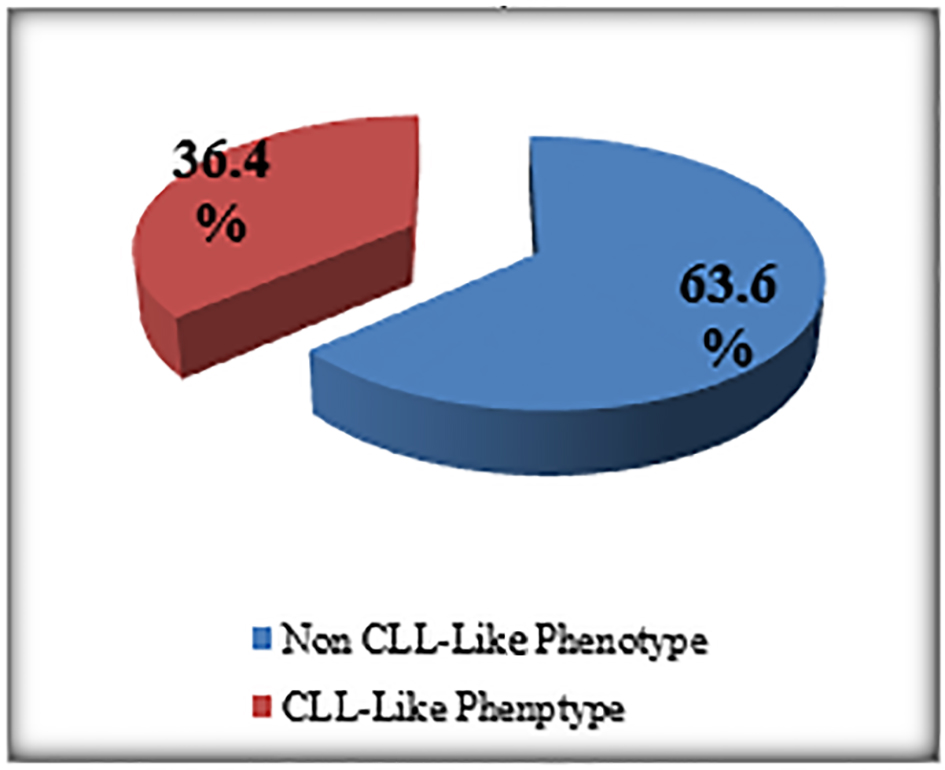
Figure 4. The prevalence of MBL subtypes among MBL patients.
Figure 5.
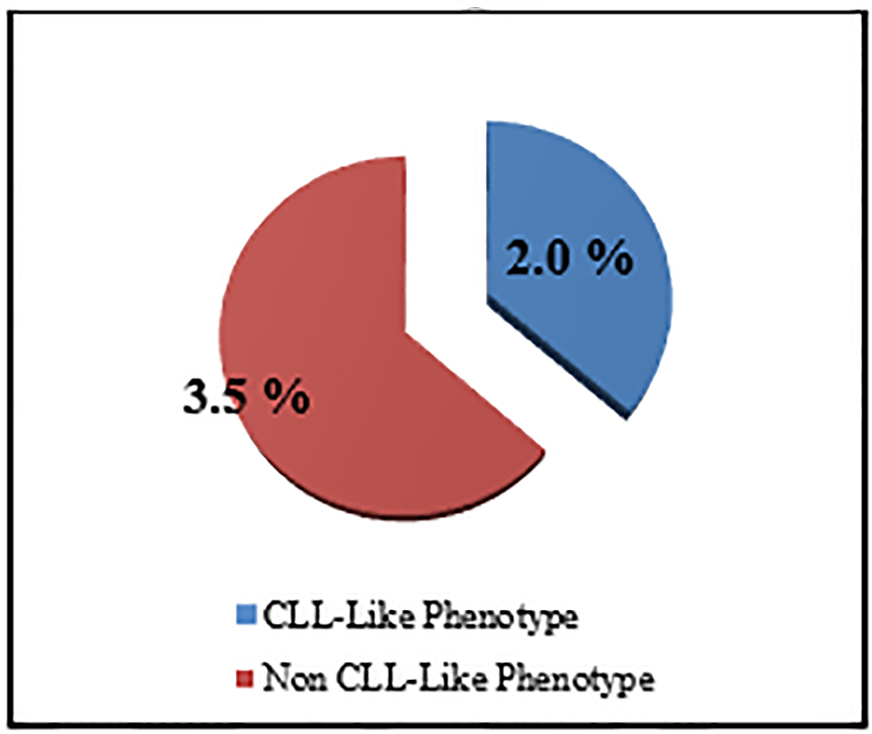
Figure 5. The prevalence of MBL subtypes among studied sample.

Table

Table 1. Demographics, Absolute Cell Counts, Immunophenotyping and Clonality Assessment of Individuals in MBL Study
 
AgeSexWBC (× 109/L)Lymph absolute (cells/µL)CD5/19 (%)K/L ratioPresumptive classification
160Male5.31,6430.1315.2Non-CLL phenotype
261Female9.53,8000.1214.1Non-CLL phenotype
361Female5.81,180152.5CLL phenotype
462Male8.53,0606.52.1CLL phenotype
564Male11.33,9553.022Non-CLL phenotype
668Female7.92,2120.48.2Non-CLL phenotype
766Female5.61,1760.656.3Non-CLL phenotype
870Male3.99361.6920.5Non-CLL phenotype
968Male7.52,4001.4811.2Non-CLL phenotype
1061Female5.51,705300.2CLL phenotype
1165Male4.71,598162.3CLL phenotype