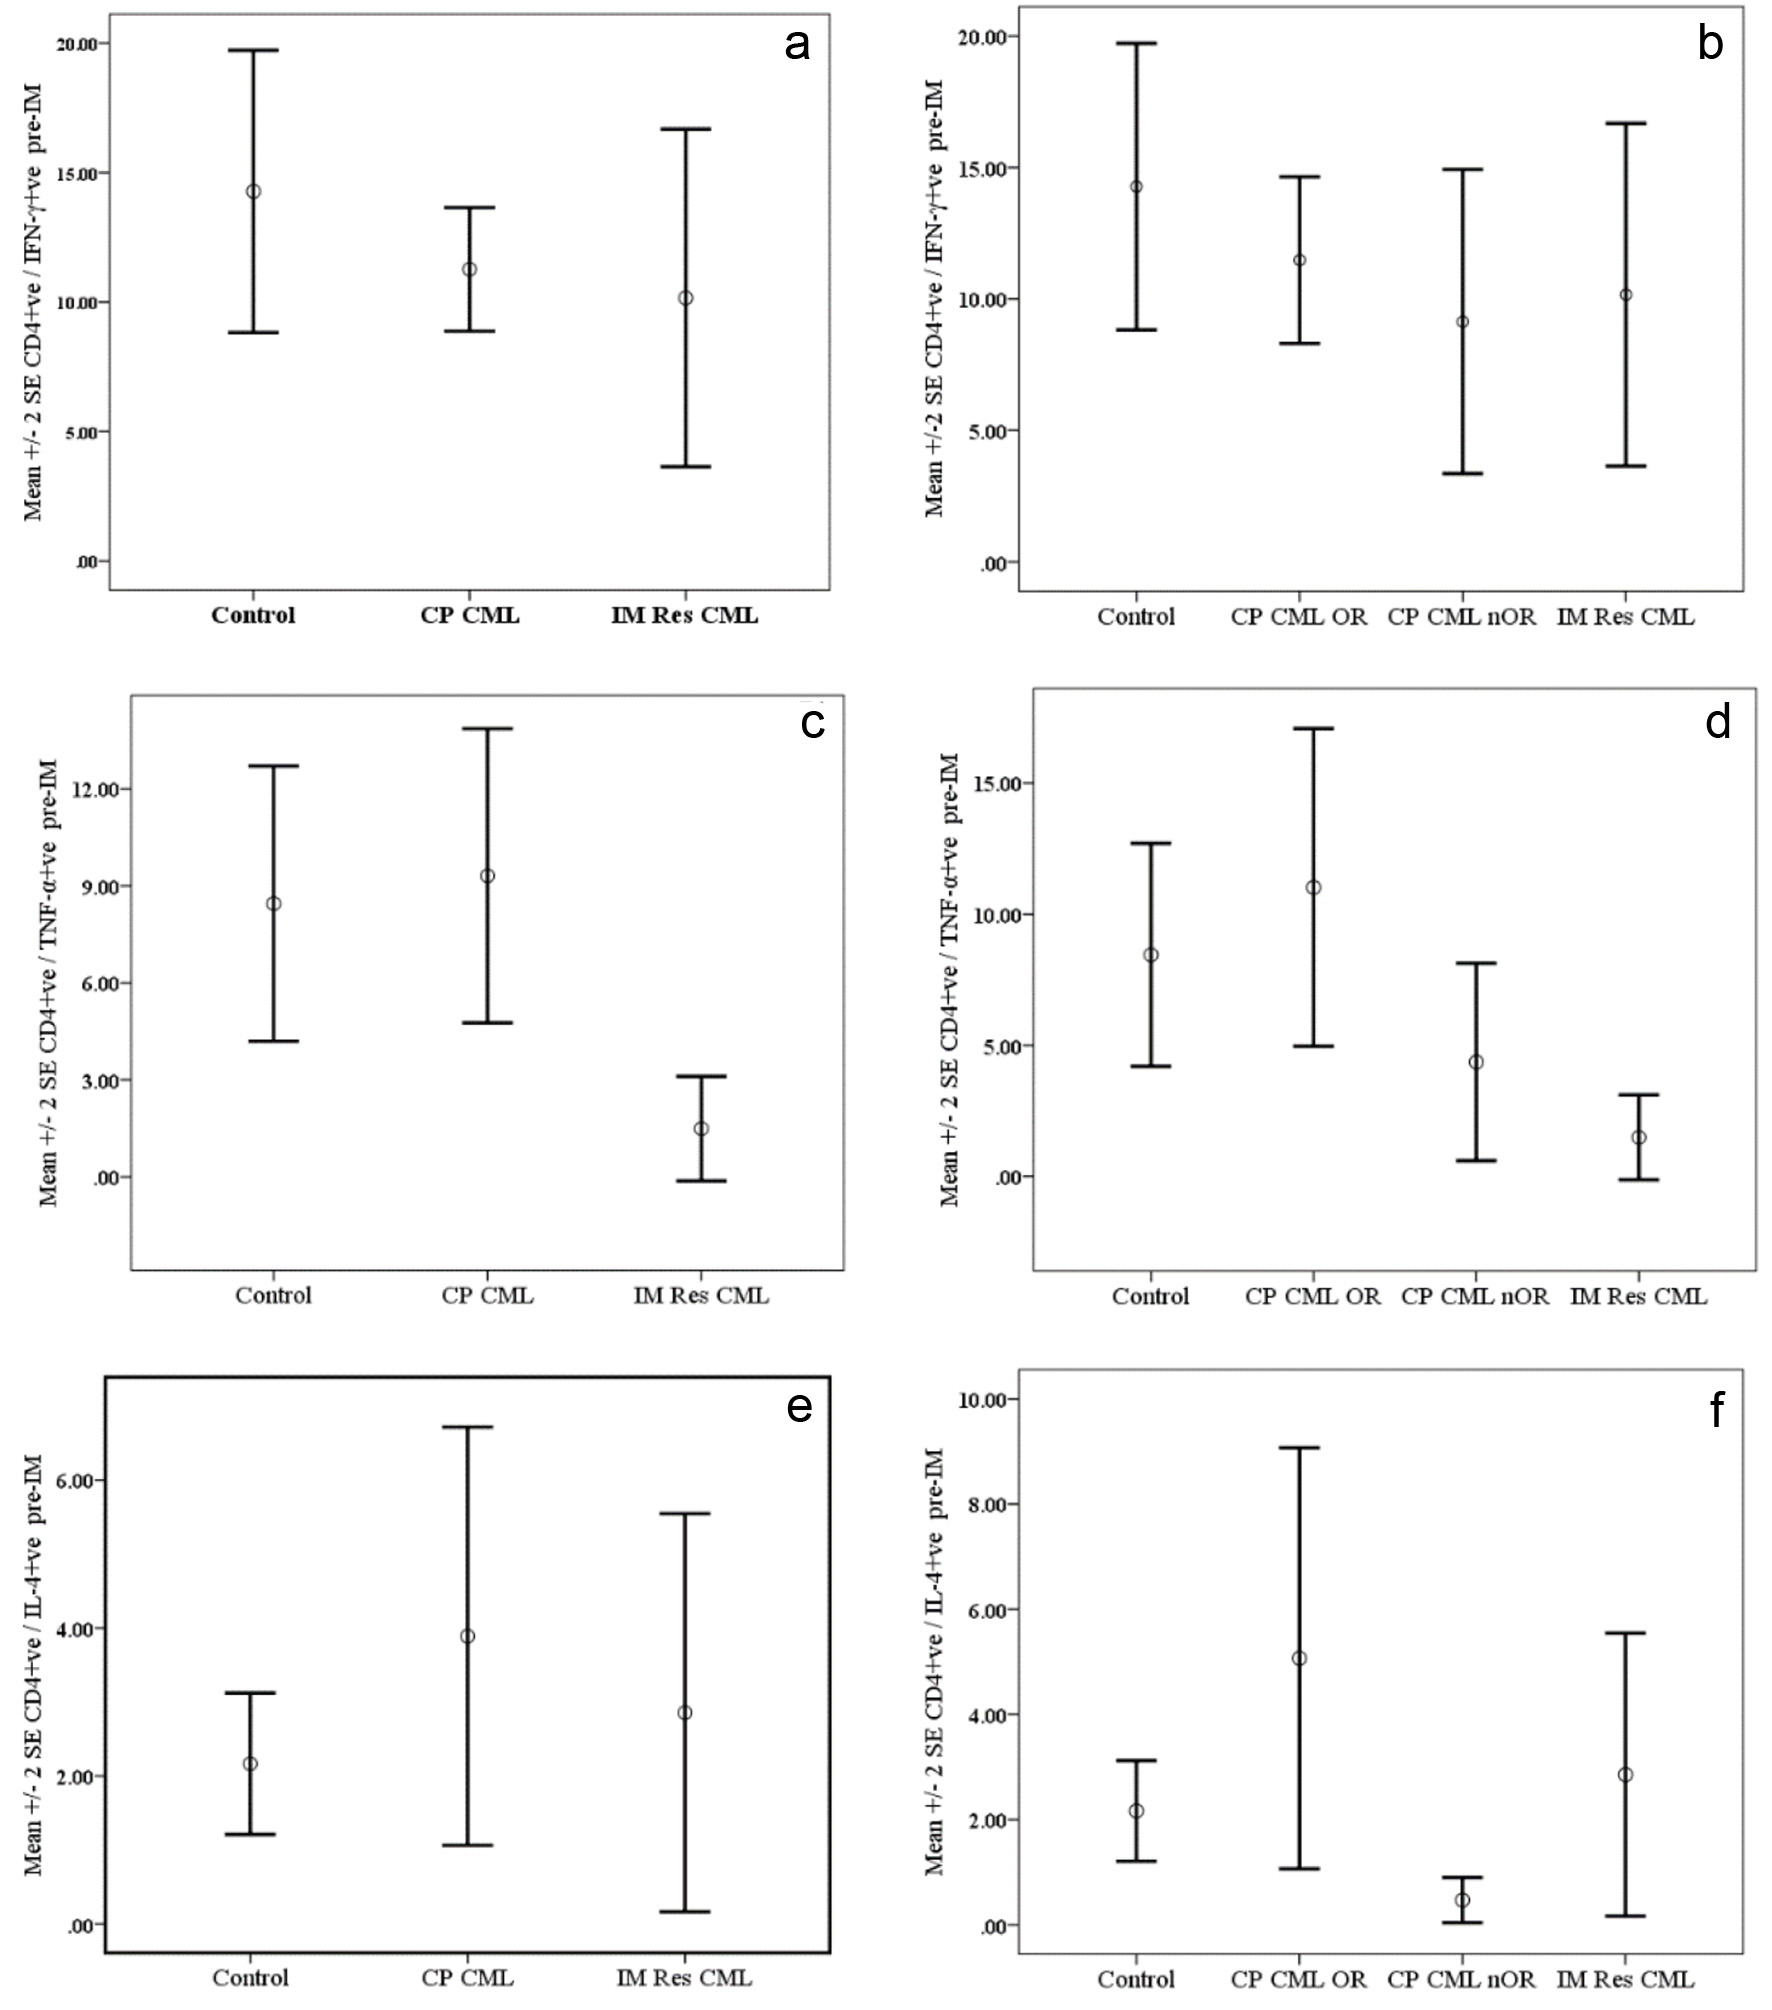
Figure 1. Cytokine synthesis by PMA-activated CD4+ve T cells from chronic phase CML (CP CM) patients pre-Imatinib therapy compared with normal controls and patients with resistance to Imatinib therapy (IM Res CML). Data are presented as mean percentages ± SEM. Data are presented as mean percentages ± SEM. a (IFN-ã), c (TNF-á) and e (IL-4) represent data for CP CM patients regardless of their response to therapy, while b (IFN-ã), d (TNF-á) and f (IL-4) represent data CP CM patients grouped according to their response to IM therapy. OR: optimal response; nOR: no optimal response.
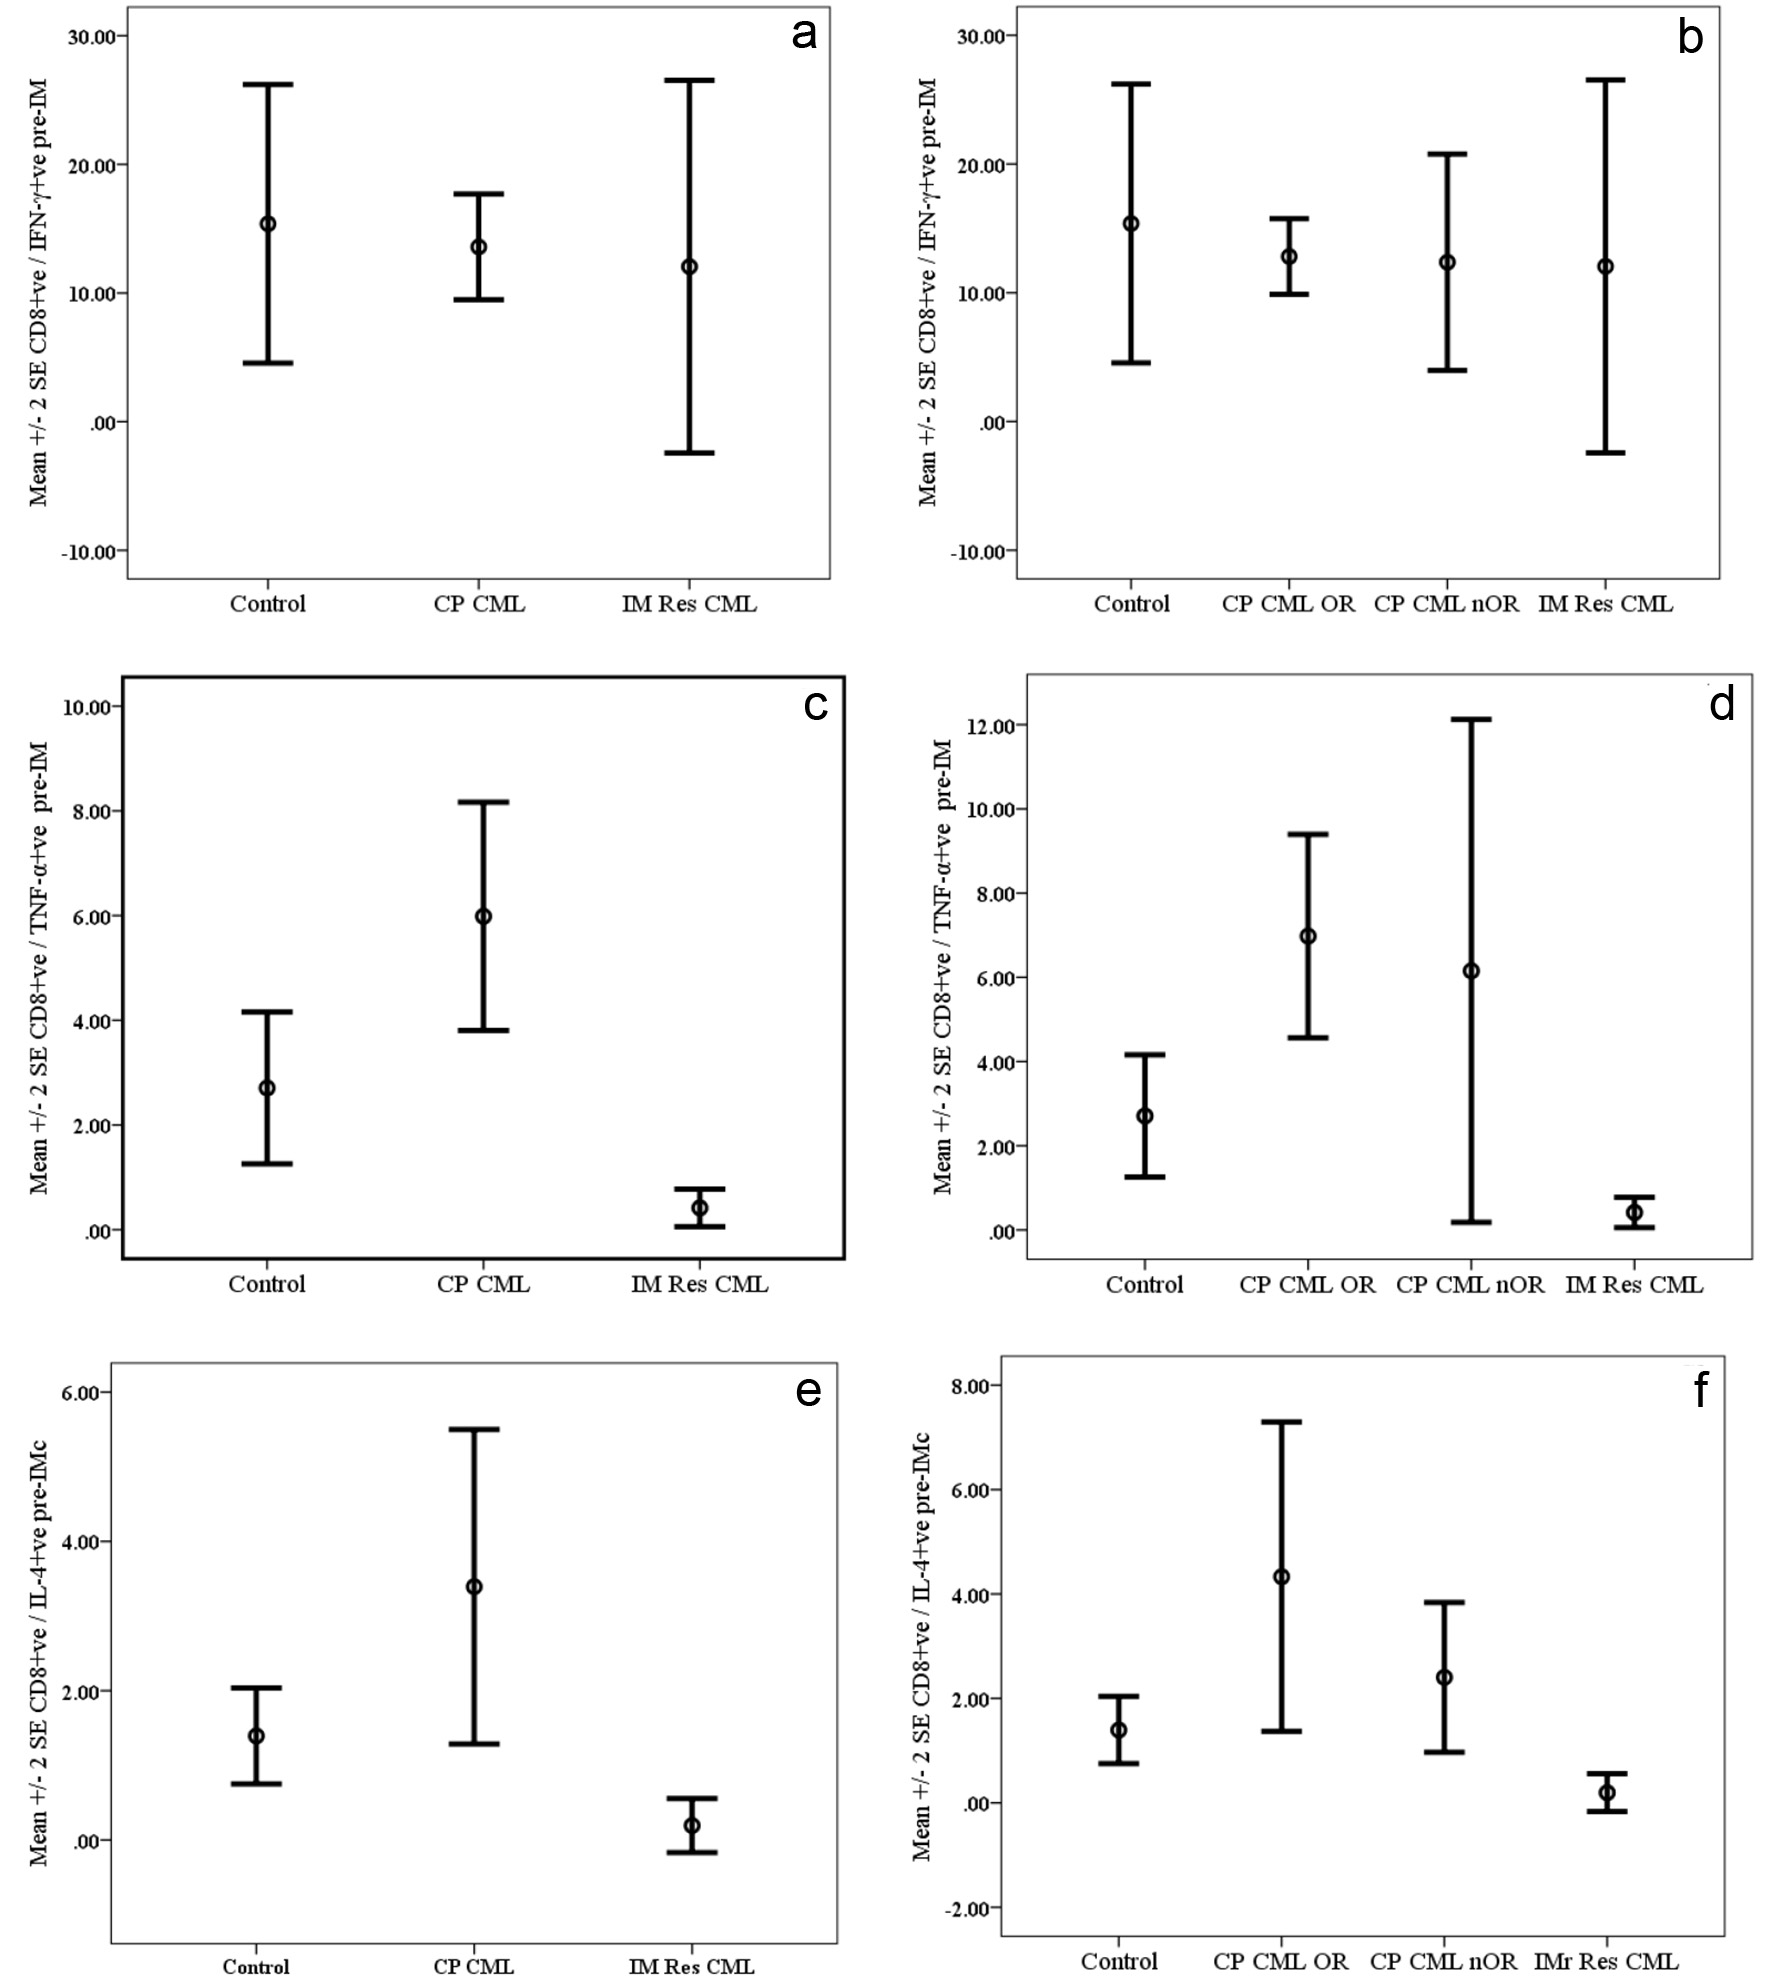
Figure 2. Cytokine synthesis by PMA-activated CD8+ve T cells from chronic phase CML (CP CML) patients pre-Imatinib therapy compared with normal controls and patients with resistance to Imatinib therapy (IM Res CML). Data are presented as mean percentages ± SEM. a (IFN-ã), c (TNF-á) and e (IL-4) represent data for CP CML patients regardless of their response to therapy, while b (IFN-ã), d (TNF-á) and f (IL-4) represent data CP CML patients grouped according to their response to IM therapy. OR: optimal response; nOR: no optimal response.
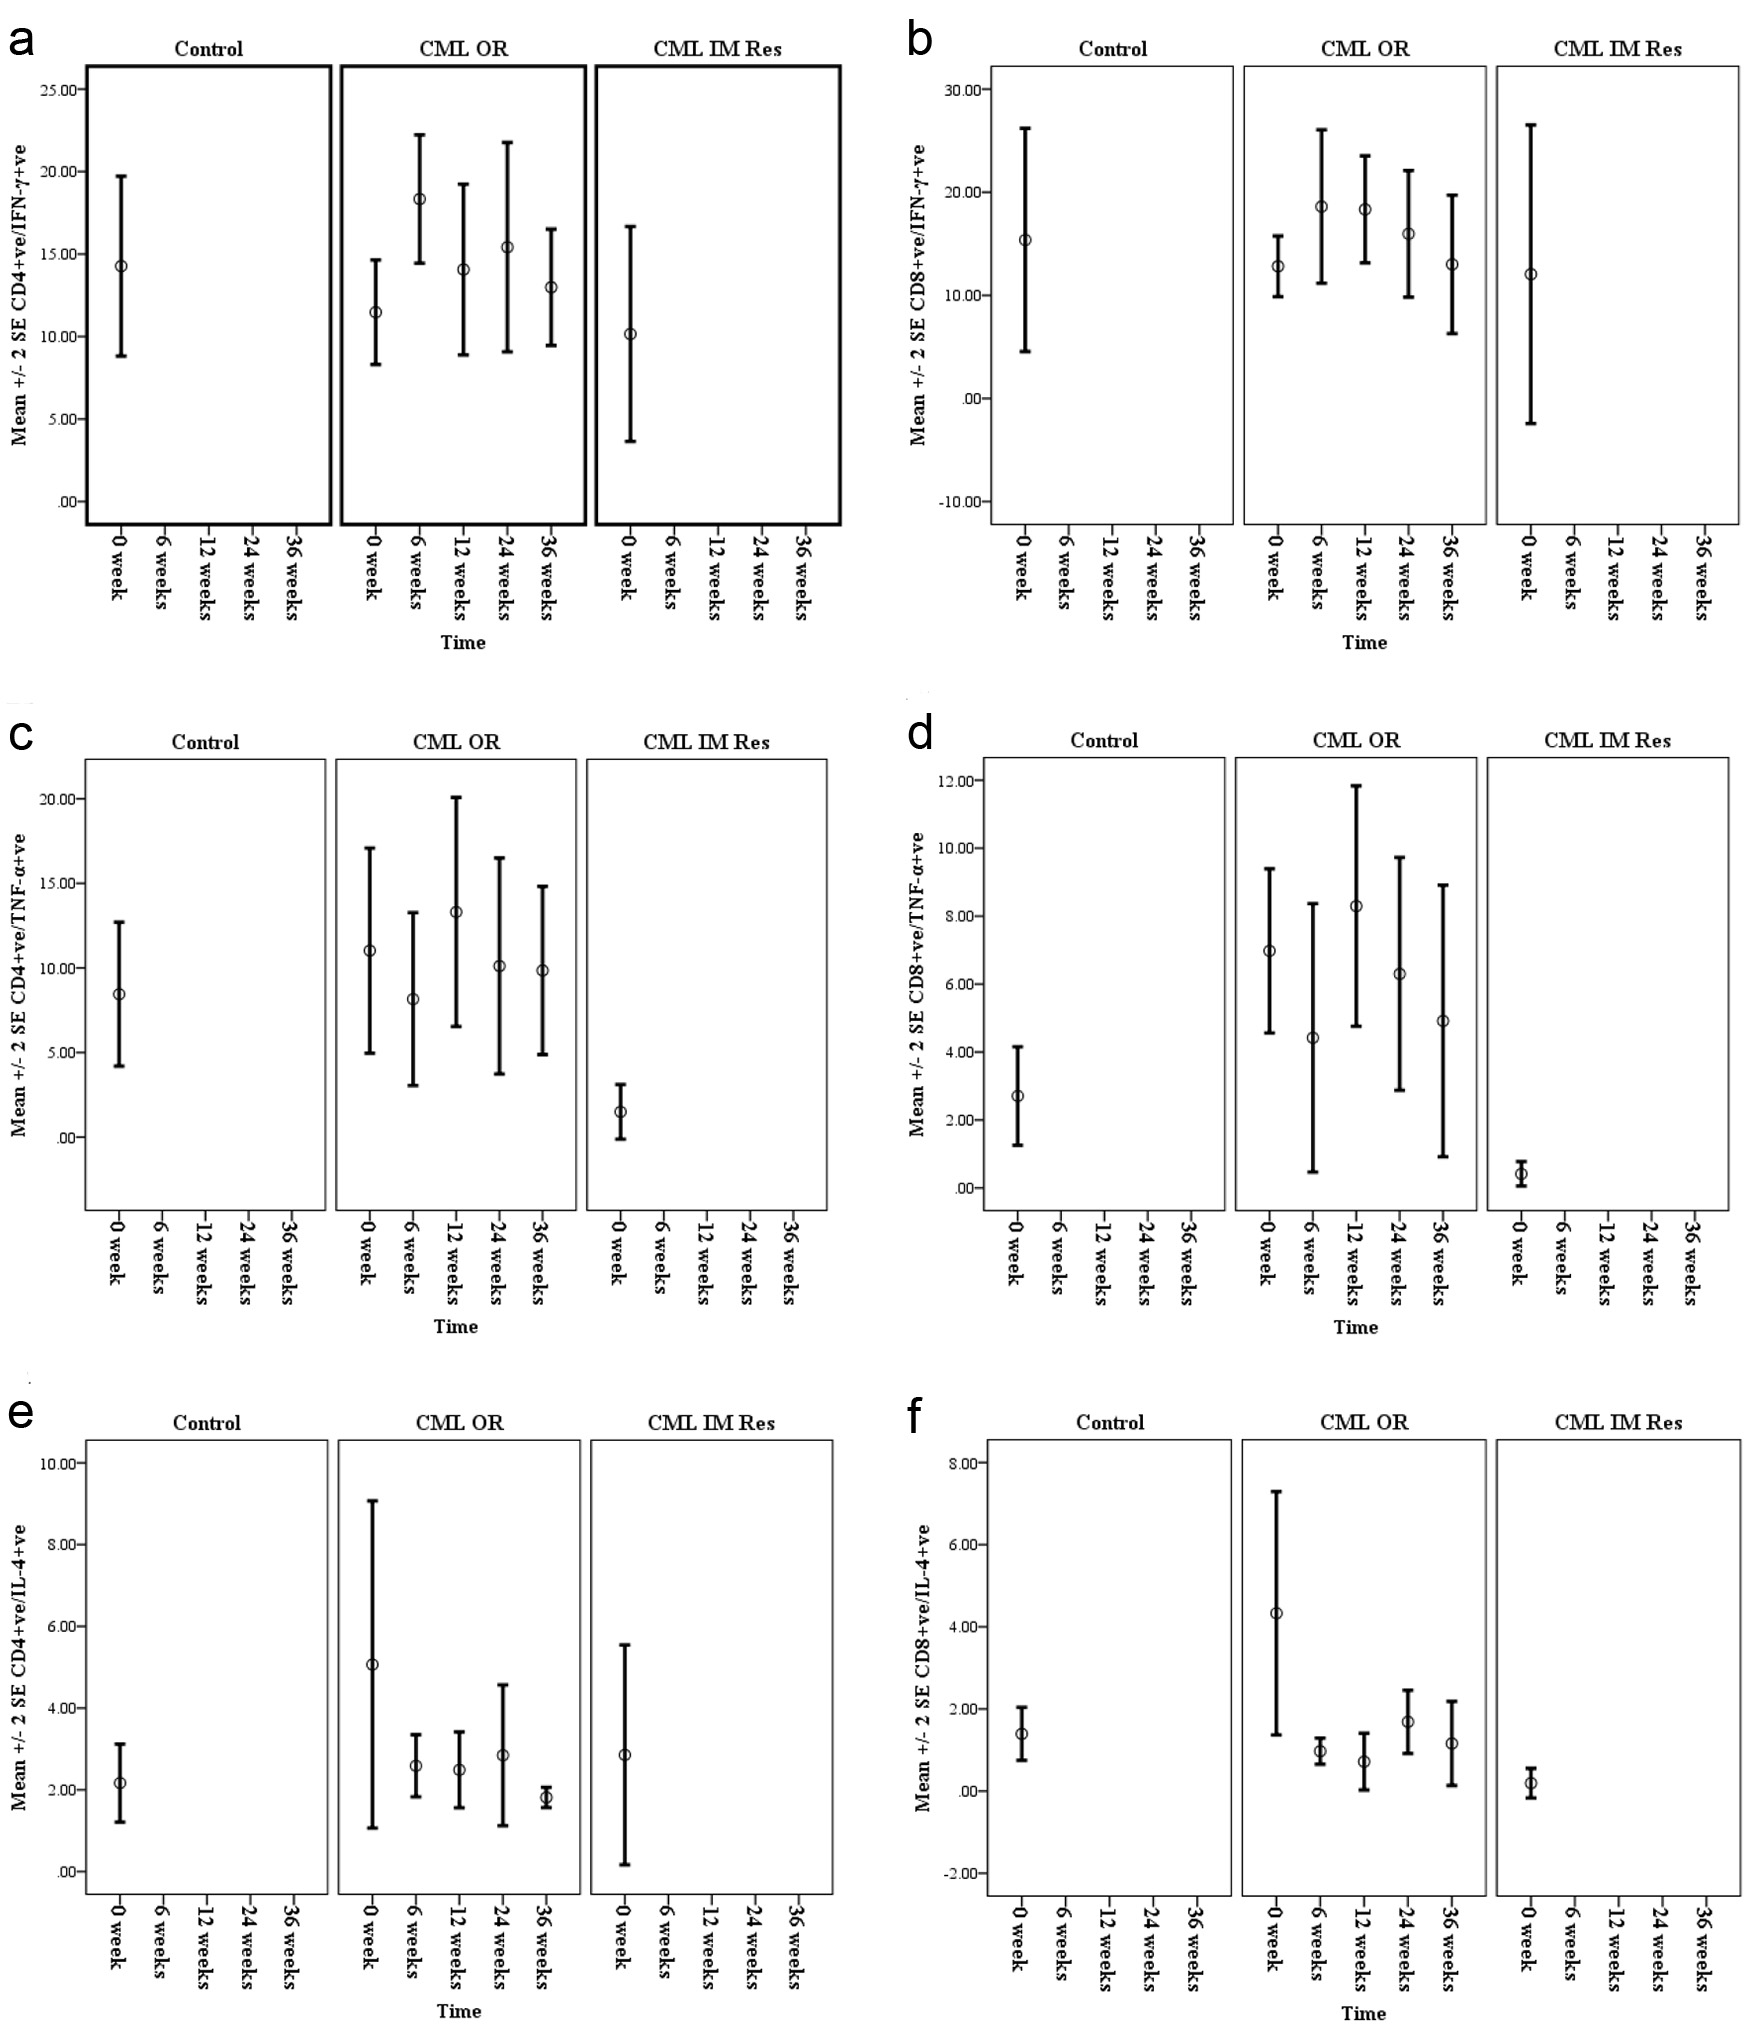
Figure 3. Mean percentages of IFN-ã (a and b), TNF-á (c and d) and IL-4 (e and f), synthesized by CD4+ve and CD8+ve T cells of chronic phase CML patients with optimal response (CML OR) pre- and during Imatinib therapy (6 weeks, 3 months, 6 months and 9 months) compared with normal controls and CML patients known to have Imatinib resistance (CML IM Res).