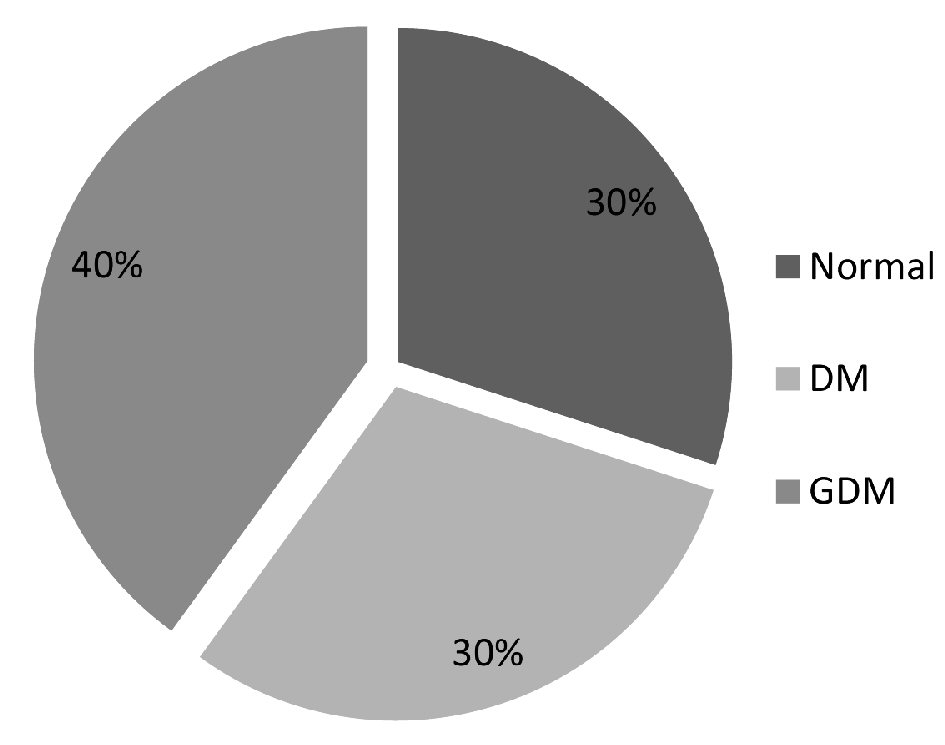
Figure 1. Distribution of the enrolled study subjects into the GDM, DM and control groups.
| Journal of Hematology, ISSN 1927-1212 print, 1927-1220 online, Open Access |
| Article copyright, the authors; Journal compilation copyright, J Hematol and Elmer Press Inc |
| Journal website http://www.thejh.org |
Original Article
Volume 7, Number 4, December 2018, pages 140-148
Morphology and Chromic Status of Red Blood Cells Are Significantly Influenced by Gestational Diabetes
Figures
Tables
| RBCs description | Normal | Occasional/rare | Mild/slight +1 | Moderate +2 | Marked +3 |
|---|---|---|---|---|---|
| MCV: mean corpuscular volume; MCH: mean corpuscular hemoglobin, fL: femtoliter; pg: pictogram. | |||||
| Microcyte | MCV 80 - 99 fL | MCV 70 - 79 fL (25% smaller than nucleus of small lymphocyte) | MCV 60 - 69 fL (26-49% smaller than nucleus of small lymphocyte) | MCV < 60 fL (≥ 50% smaller than nucleus of small lymphocyte) | |
| Macrocyte | MCV 100 - 110 fL (25% larger than nucleus of small lymphocyte) | MCV 111 - 125 fL (26-49% larger than nucleus of small lymphocyte) | MCV > 125 fL (≥ 50% larger than nucleus of small lymphocyte) | ||
| Hypochromasia | MCH 27 - 34 pg | < 5% but present | 5-15% (MCH 2 - 26 pg) | 16-40% (MCH 18 - 21 pg) | > 40% (MCH < 18 pg) |
| Polychromasia | < 3% but present | 3-5% | 6-20% | > 20% | |
| Target cells | < 5% but present | 5-10% | 11-25% | > 25% | |
| Oval macrocytes | < 5% but present | 6-20% | 21-50% | > 50% | |
| Anisocytosis | < 15% | 15-25% | 26-49% | 50-89% | |
| Poikilocytosis | < 1% | 1-5% | 6-10% | > 10% | |
| Variables | GDM | DM | Control |
|---|---|---|---|
| BMI: body mass index; FBG: fasting blood glucose; RBCs: red blood cells; Hb: hemoglobin; MCV: mean corpuscular volume; HCT: hematocrit; MPV: mean platelet volume; RDW: red cells distribution width. | |||
| Age (years) | 33.33 ± 4.8 | 34 ± 5.1 | 32.13 ± 2.8 |
| Parity (number) | 2.73 ± 1.8 | 2.17 ± 1.4 | 1.47 ± 1.3 |
| Gestational age (weeks) | 34.8 ± 2.9 | 35.5 ± 2 | 34.7 ± 4.6 |
| BMI (kg/m2) | 35.024 ± 3.1 | 35.02 ± 5.3 | 34.744 ± 4.4 |
| FBS (mg/dL) | 148.62 ± 42.5 | 164.99 ± 34.5 | 76.4 ± 10.2 |
| RBCs (106/uL) | 4.217 ± 0.5 | 4.207 ± 0.45 | 4.181 ± 0.4 |
| Hb (g/dL) | 11.15 ± 1.1 | 10.89 ± 1.3 | 11.543 ± 1.2 |
| MCV (fL) | 80.3 ± 4.6 | 78.2 ± 33.3 | 83 ± 34.6 |
| HCT (%) | 32.9 ± 5.6 | 33.3 ± 4.1 | 34.6 ± 3.4 |
| RDW (%) | 15.65 ± 2.2 | 16.19 ± 2.8 | 15.25 ± 3 |
| P-value (GDM vs. control) | P-value (GDM vs. DM) | |
|---|---|---|
| BMI: body mass index; FBG: fasting blood glucose; RBCs: red blood cells; Hb: hemoglobin; MCV: mean corpuscular volume; HCT: hematocrit; MPV: mean platelet volume; RDW: red cells distribution width. *P-values denoting statistical significance. | ||
| Age | 0.232 | 0.572 |
| Parity | 0.002* | 0.153 |
| Gestational age | 0.1 | 0.268 |
| BMI | 0.757 | 0.997 |
| FBS | 0.001* | 0.08 |
| RBCs | 0.739 | 0.92 |
| Hb | 0.53 | 0.739 |
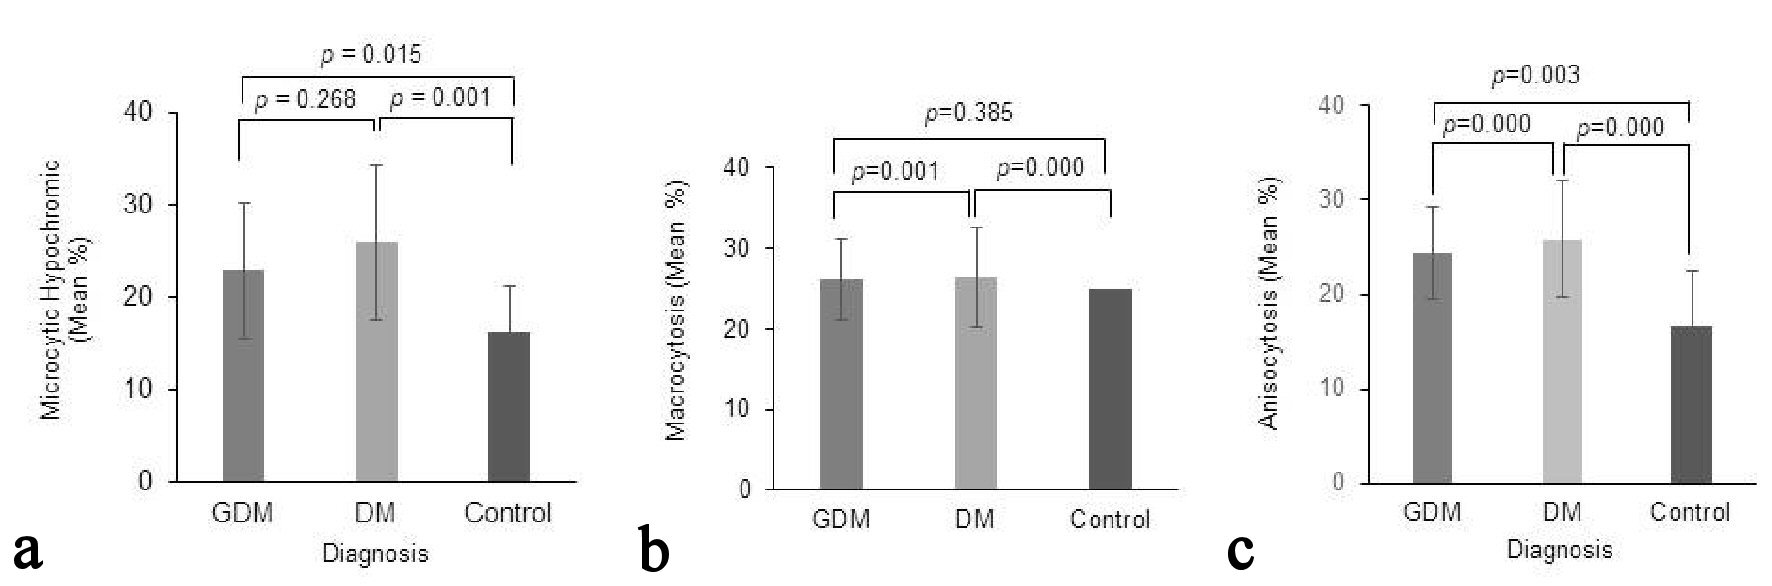
| MCV | 0.034* | 0.308 |
| HCT | 0.152 | 0.742 |
| RDW | 0.523 | 0.366 |
| RBCs morphology | GDM | DM | Control | Total count | |||
|---|---|---|---|---|---|---|---|
| Count | Percentage | Count | Percentage | Count | Percentage | ||
| Normocytic normochromic | |||||||
| Yes | 23 | 57.50% | 9 | 30% | 25 | 83.30% | 57 |
| No | 17 | 42.50% | 21 | 70% | 5 | 16.70% | 43 |
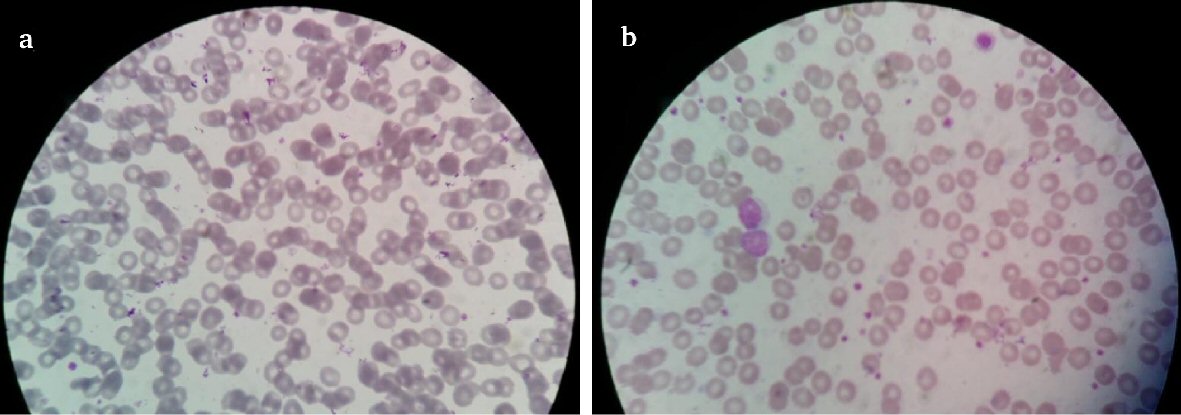
| Microcytic hypochromic | |||||||
| Few | 16 | 40% | 16 | 35.30% | 4 | 13.30% | 36 |
| No | 24 | 60% | 14 | 46.70% | 26 | 86.70% | 64 |
| Anisocytosis | |||||||
| Mild | 17 | 42.50% | 28 | 93.30% | 3 | 10% | 48 |
| No | 23 | 57.50% | 2 | 6.70% | 27 | 90% | 52 |
| Poikilocytosis | |||||||
| Mild | 3 | 7.50% | 12 | 40% | 0 | 0 | 16 |
| No | 37 | 92.50% | 18 | 60% | 30 | 100% | 86 |
| Target cells | |||||||
| Occasional | 5 | 12.50% | 12 | 40% | 0 | 0 | 17 |
| No | 35 | 87.50% | 18 | 60% | 30 | 100% | 83 |
| Macrocytes | |||||||
| Occasional | 4 | 10% | 14 | 46.70% | 1 | 3.30% | 19 |
| No | 36 | 90% | 16 | 53.30% | 29 | 96.70% | 81 |
| Normocytic normochromic | Microcytic hypochromic | Anisocytosis | Poikilocytosis | Target cells | Macrocytes | ||
|---|---|---|---|---|---|---|---|
| *P-values denoting statistical significance. | |||||||
| GDM vs. control | Chi-square | 5.309 | 5.973 | 8.873 | 2.351 | 4.038 | 1.149 |
| P-value | 0.021* | 0.015* | 0.003* | 0.125 | 0.255 | 0.383 | |
| GDM vs. DM | Chi-square | 5.224 | 1.228 | 19.294 | 10.755 | 7.05 | 12.066 |
| P-value | 0.022* | 0.268 | 0.000011* | 0.001* | 0.008* | 0.001* | |
| DM vs. Control | Chi-square | 17.376 | 10.8 | 41.713 | 15 | 15 | 15.022 |
| P-value | 0.000031* | 0.001* | 0.000000* | 0.000108* | 0.000108* | 0.000106* | |