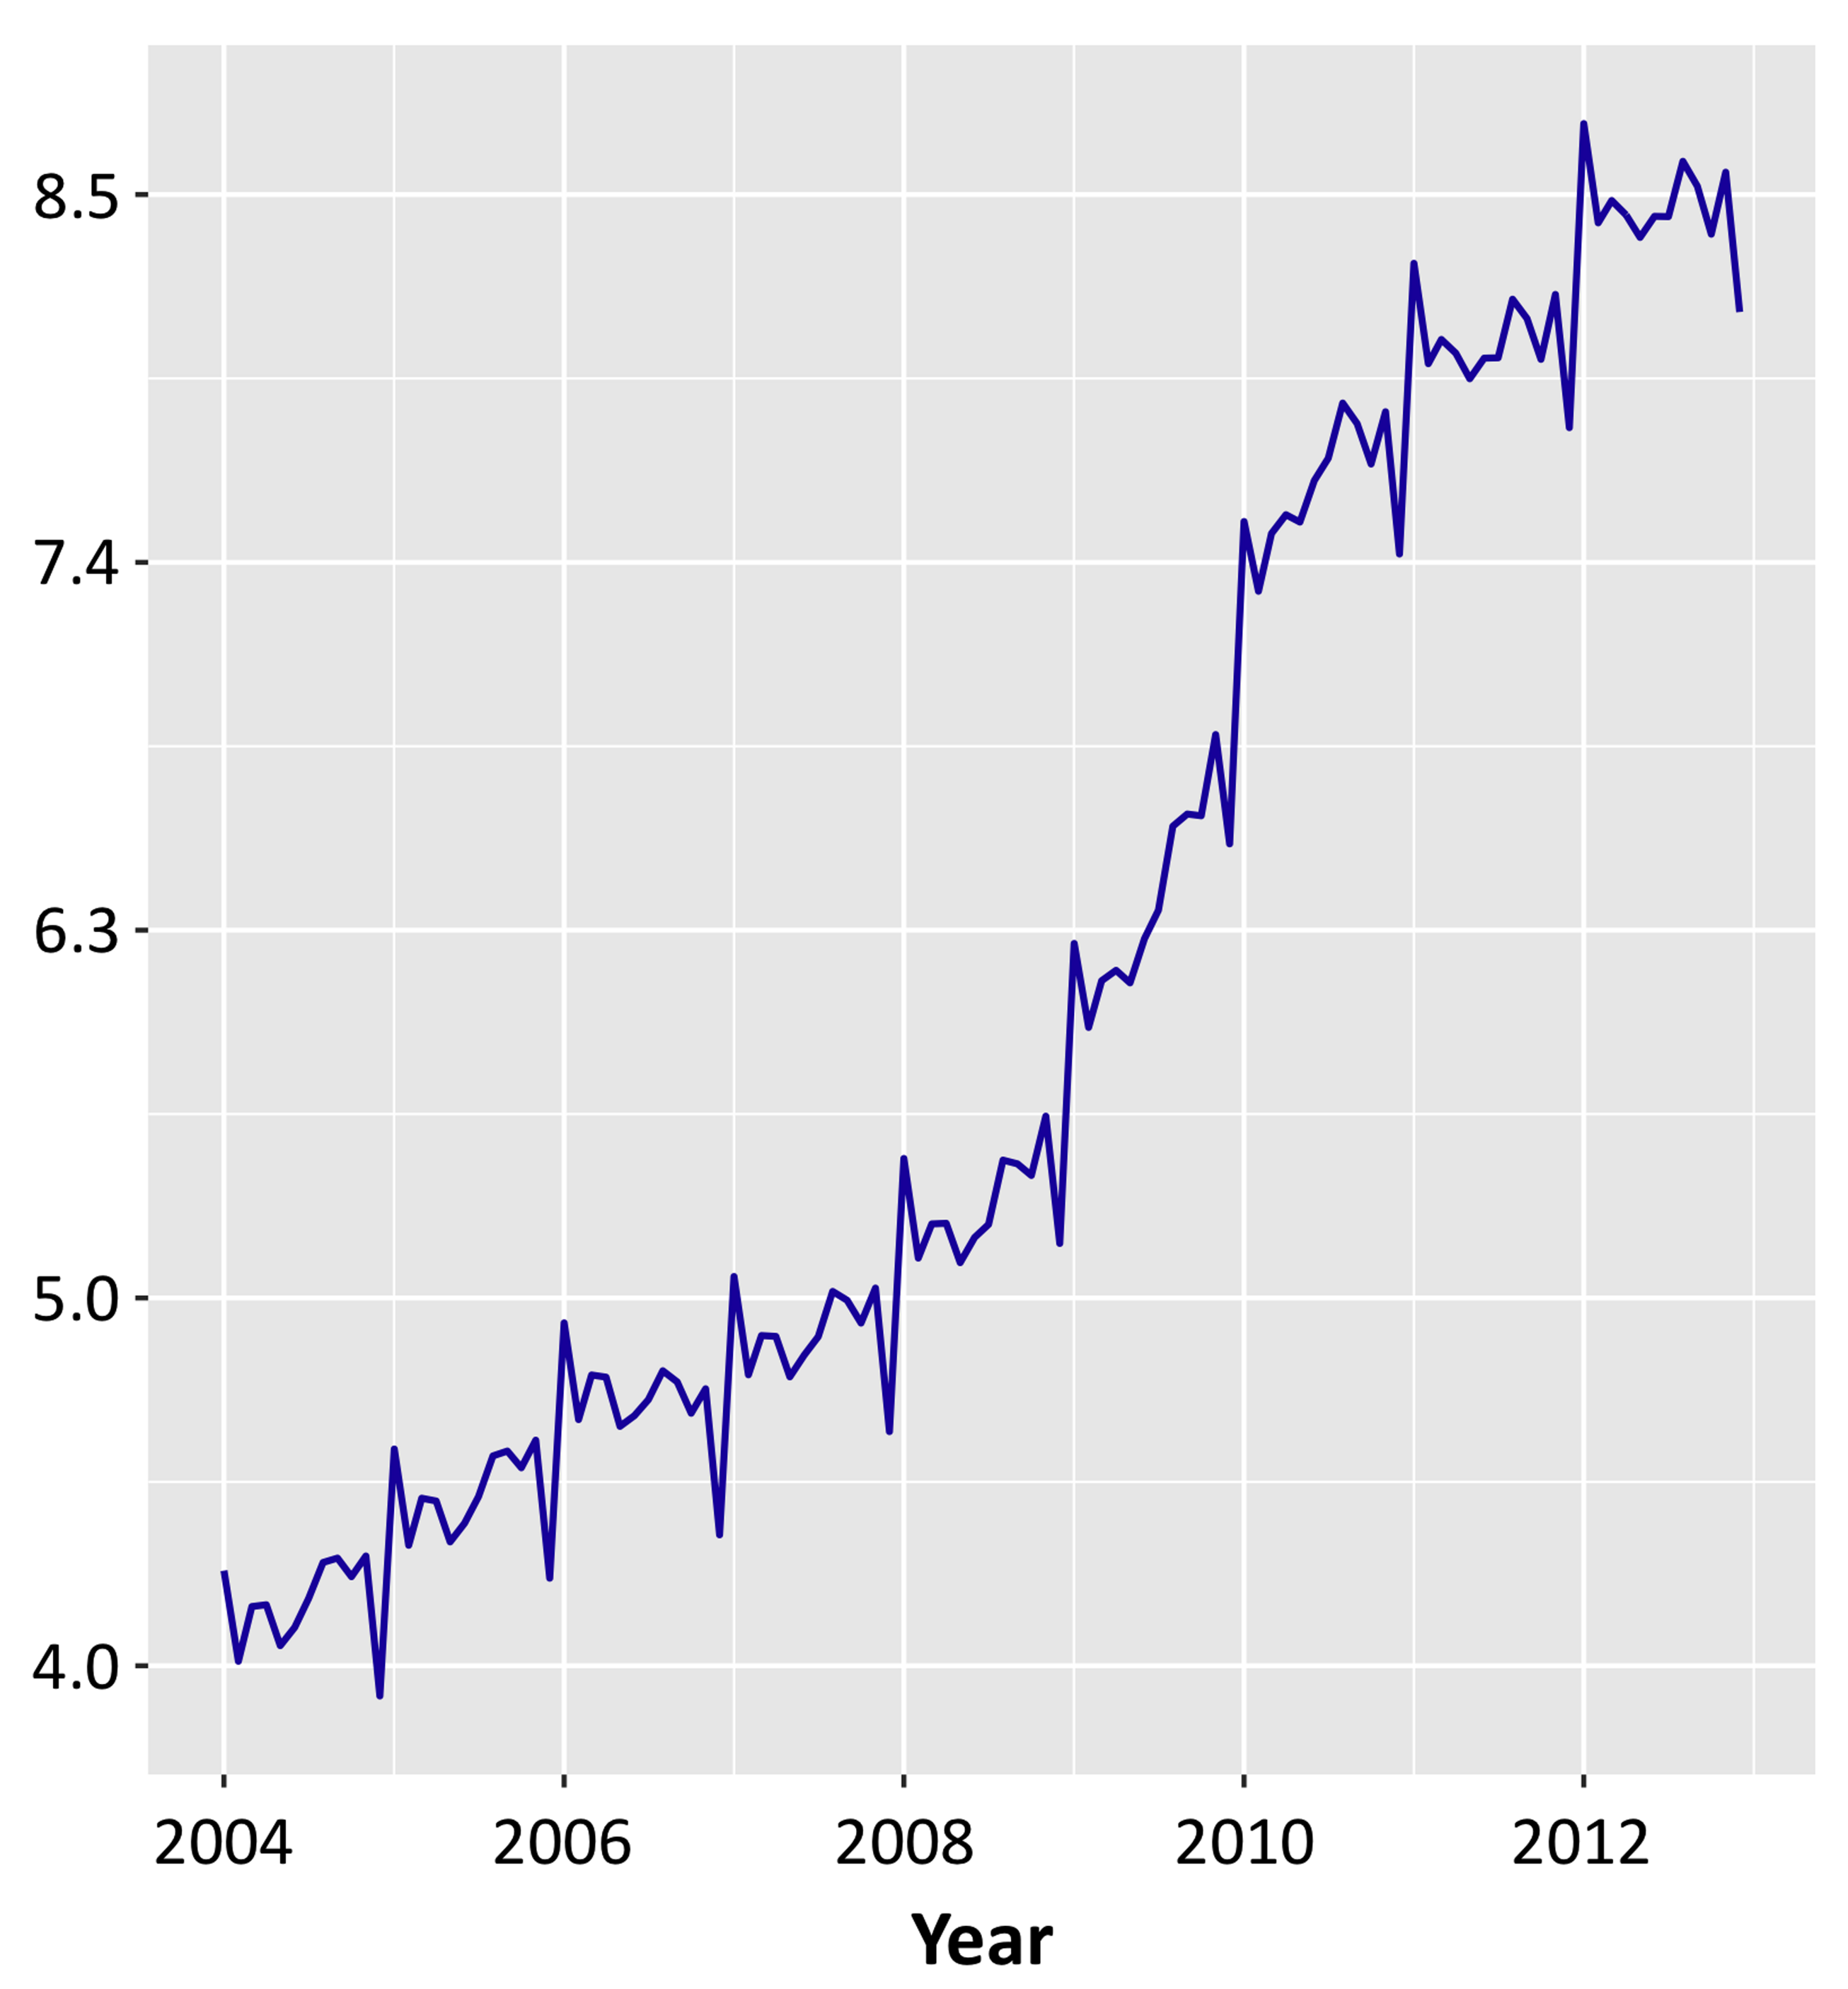
Figure 1. Monthly incidence of hospitalizations for SCD complications, per 100,000 African-American population. SCD: sickle cell disease.
| Journal of Hematology, ISSN 1927-1212 print, 1927-1220 online, Open Access |
| Article copyright, the authors; Journal compilation copyright, J Hematol and Elmer Press Inc |
| Journal website http://www.thejh.org |
Original Article
Volume 8, Number 1, March 2019, pages 11-16
Trends in Hospitalizations for Sickle Cell Disease Related-Complications in USA 2004 - 2012
Figures
Table
| 2004 | 2005 | 2006 | 2007 | 2008 | 2009 | 2010 | 2011 | 2012 | ||
|---|---|---|---|---|---|---|---|---|---|---|
| *P < 0.001 by Chi-squared test; **P < 0.001 by independent samples Kruskal-Wallis test (for skewed distributions). | ||||||||||
| N admissions, weighted | 39,802 | 45,957 | 43,916 | 49,440 | 48,639 | 52,181 | 63,277 | 57,861 | 56,635 | |
| Black population | 37,510,582 | 37,961,688 | 38,443,048 | 38,935,533 | 39,429,414 | 39,902,270 | 40,357,516 | 40,775,287 | 41,204,793 | |
| Hospitalization rate, per 100,000 | 106.1 | 121.1 | 114.2 | 127.0 | 123.4 | 130.8 | 156.8 | 141.9 | 137.4 | |
| Gender* | Male | 17,819 (44.8%) | 20,991 (45.8%) | 18,715 (42.7%) | 21,736 (44.0%) | 21,669 (44.6%) | 23,305 (44.7%) | 27,796 (44.0%) | 24,057 (41.6%) | 24,595 (43.4%) |
| Female | 21,922 (55.2%) | 24,857 (54.2%) | 25,105 (57.3%) | 27,645 (56.0%) | 26,885 (55.4%) | 28,794 (55.3%) | 35,396 (56.0%) | 33,743 (58.4%) | 32,040 (56.6%) | |
| Median household income quartile* | First | 20,831 (53.1%) | 20,296 (45.1%) | 20,573 (47.9%) | 23,467 (49.0%) | 24,161 (50.6%) | 23,066 (45.7%) | 29,583 (48.6%) | 26,803 (47.3%) | 26,780 (48.4%) |
| Second | 8,907 (22.7%) | 10,876 (24.2%) | 10,595 (24.7%) | 11,028 (23.0%) | 10,494 (22.0%) | 12,915 (25.6%) | 14,466 (23.8%) | 12,076 (21.3%) | 12,055 (21.8%) | |
| Third | 5,395 (13.8%) | 8,281 (18.4%) | 7,434 (17.3%) | 7,896 (16.5%) | 8,054 (16.9%) | 8,175 (16.2%) | 10,274 (16.9%) | 11,420 (20.1%) | 9,830 (17.8%) | |
| Fourth | 4,071 (10.4%) | 5,501 (12.2%) | 4,314 (10.1%) | 5,464 (11.4%) | 5,034 (10.5%) | 6,319 (12.5%) | 6,541 (10.7%) | 6,402 (11.3%) | 6,690 (12.1%) | |
| In-hospital mortality, N (%)† | 409 (1.03%) | 401 (0.87%) | 459 (1.05%) | 473 (0.96%) | 440 (0.90%) | 490 (0.94%) | 534 (0.84%) | 494 (0.85%) | 575 (1.02%) | |
| Primary payer* | Medicare | 10,028 (25.3%) | 10,966 (23.9%) | 11,812 (26.9%) | 13,407 (27.2%) | 13,283 (27.4%) | 15,183 (29.2%) | 17,078 (27.1%) | 18,729 (32.4%) | 17,500 (31.0%) |
| Medicaid | 20,151 (50.9%) | 22,720 (49.5%) | 20,648 (47.0%) | 22,116 (44.8%) | 20,070 (47.5%) | 24,029 (46.1%) | 29,722 (27.1%) | 25,298 (43.8%) | 25,910 (45.8%) | |
| Private | 7,073 (17.9%) | 9,045 (19.7%) | 8,670 (19.8%) | 9,204 (18.7%) | 9,046 (18.6%) | 8,790 (16.9%) | 12,065 (19.1%) | 10,420 (18.0%) | 9,390 (16.6%) | |
| Self-pay | 1,290 (3.3%) | 1,587 (3.5%) | 1309 (3.0%) | 2,231 (4.5%) | 1,894 (3.9%) | 2,559 (4.9%) | 2,498 (4.0%) | 1,916 (3.3%) | 2,045 (3.6%) | |
| No charge | 163 (0.4%) | 208 (0.5%) | 31 (0.1%) | 406 (0.8%) | 202 (0.4%) | 207 (0.4%) | 223 (0.4%) | 136 (0.2%) | 165 (0.3%) | |
| Admission type* | Emergency | 28,159 (75.3%) | 31,167 (72.8%) | 31,285 (76.6%) | 36,117 (76.7%) | 35,150 (78.4%) | 35,852 (74.5%) | 45,337 (75.6%) | 41,226 (76.4%) | N/A |
| Urgent | 5,665 (15.1%) | 6,404 (15.0%) | 5,944 (14.6%) | 6,535 (13.9%) | 5,566 (12.4%) | 8,812 (18.3%) | 9,008 (15.0%) | 8,388 (15.6%) | ||
| Elective | 3,558 (9.5%) | 4,803 (11.2%) | 3,601 (8.8%) | 4,405 (9.4%) | 4,108 (9.2%) | 3,433 (7.1%) | 5,592 (9.3%) | 4,276 (7.9%) | ||
| Location & teaching status of hospital* | Rural | 1,929 (4.8%) | 2,858 (6.2%) | 2,470 (5.6%) | 3,071 (6.2%) | 2,744 (5.6%) | 2,483 (4.9%) | 3,219 (5.2%) | 4,085 (7.2%) | 2,475 (4.4%) |
| Urban nonteach. | 11,704 (29.4%) | 12,390 (27.0%) | 12,068 (27.5%) | 14,693 (29.8%) | 14,396 (29.6%) | 15,373 (30.6%) | 14,431 (23.3%) | 16,932 (29.7%) | 14,980 (26.5%) | |
| Urban teach. | 26,168 (65.7%) | 30,709 (66.8%) | 29,304 (66.8%) | 31,617 (64.0%) | 31,499 (64.8%) | 32,371 (64.4%) | 44,460 (71.6%) | 36,087 (63.2%) | 39,180 (69.2%) | |
| Region of hospital* | Northeast | 8,168 (20.5%) | 8,386 (18.2%) | 10,878 (24.8%) | 7,938 (16.1%) | 9,238 (19.0%) | 9,676 (18.5%) | 12,157 (19.2%) | 11,308 (19.5%) | 11,165 (19.7%) |
| Midwest | 7,338 (18.4%) | 8,859 (19.3%) | 7,724 (17.6%) | 8,284 (16.8%) | 6,396 (13.2%) | 11,386 (21.8%) | 9,920 (15.7%) | 10,114 (17.5%) | 10,355 (18.3%) | |
| South | 21,398 (53.8%) | 24,353 (53.0%) | 21,164 (48.2%) | 29,550 (59.8%) | 27,559 (56.7%) | 25,769 (49.4%) | 36,709 (58.0%) | 31,326 (54.1%) | 29,280 (51.7%) | |
| West | 2,898 (7.3%) | 4,359 (9.5%) | 4,150 (9.4%) | 3,668 (7.4%) | 5,446 (11.2%) | 5,350 (10.3%) | 4,492 (7.1%) | 5,112 (8.8%) | 5,835 (10.3%) | |
| Age, years**, mean ± SD, median (IQR) | 28.7 ± 14.5, 27 (20 - 38) | 27.4 ± 15.1, 26 (17 - 37) | 29.68 ± 14.44, 28 (20 - 39) | 29.65 ± 14.35, 28 (21 - 39) | 29.64 ± 14.50, 28 (21 - 39) | 30.30 ± 14.29, 29 (22 - 40) | 28.77 ± 14.73, 27 (20 - 37) | 31.47 ± 14.21, 30 (22 - 40) | 30.34 ± 14.84, 29 (22 - 39) | |
| LOS, days**, mean ± SD, median (IQR) | 7.12 ± 7.65, 5 (3 - 9) | 7.08 ± 8.24 5 (3 - 8) | 7.05 ± 7.94, 5 (3 - 9) | 6.97 ± 7.49, 5 (3 - 8) | 6.61 ± 6.85, 5 (3 - 8) | 6.46 ± 6.25, 5 (3 - 8) | 6.40 ± 6.43, 5 (3 - 8) | 6.37 ± 7.16, 5 (3 - 8) | 6.23 ± 6.42, 5 (3 -8) | |
| Charges, thousand dollars**, mean ± SD, median (IQR) | 25.36 ± 37.91, 15.35 (8.99 - 27.57) | 27.33 ± 39.83, 16.32 (9.19 - 29.96) | 29.86 ± 41.64, 18.15 (10.39 - 34.09) | 33.38 ± 49.69, 20.51 (11.66 - 36.88) | 30.98 ± 44.57, 19.26 (11.45 - 35.19) | 35.32 ± 47.72, 21.95 (12.47 - 39.75) | 35.49 ± 50.34, 22.14 (12.80 - 40.48) | 39.03 ± 80.02, 23.54 (13.81 - 42.37) | 41.32 ± 68.74, 24.78 (14.37 - 45.24) | |