Journal of Hematology, ISSN 1927-1212 print, 1927-1220 online, Open Access |
Article copyright, the authors; Journal compilation copyright, J Hematol and Elmer Press Inc |
Journal website http://www.thejh.org |
Short Communication
Volume 8, Number 2, June 2019, pages 55-59
C-Reactive Protein Level: A Key Predictive Marker of Cachexia in Lymphoma and Myeloma Patients
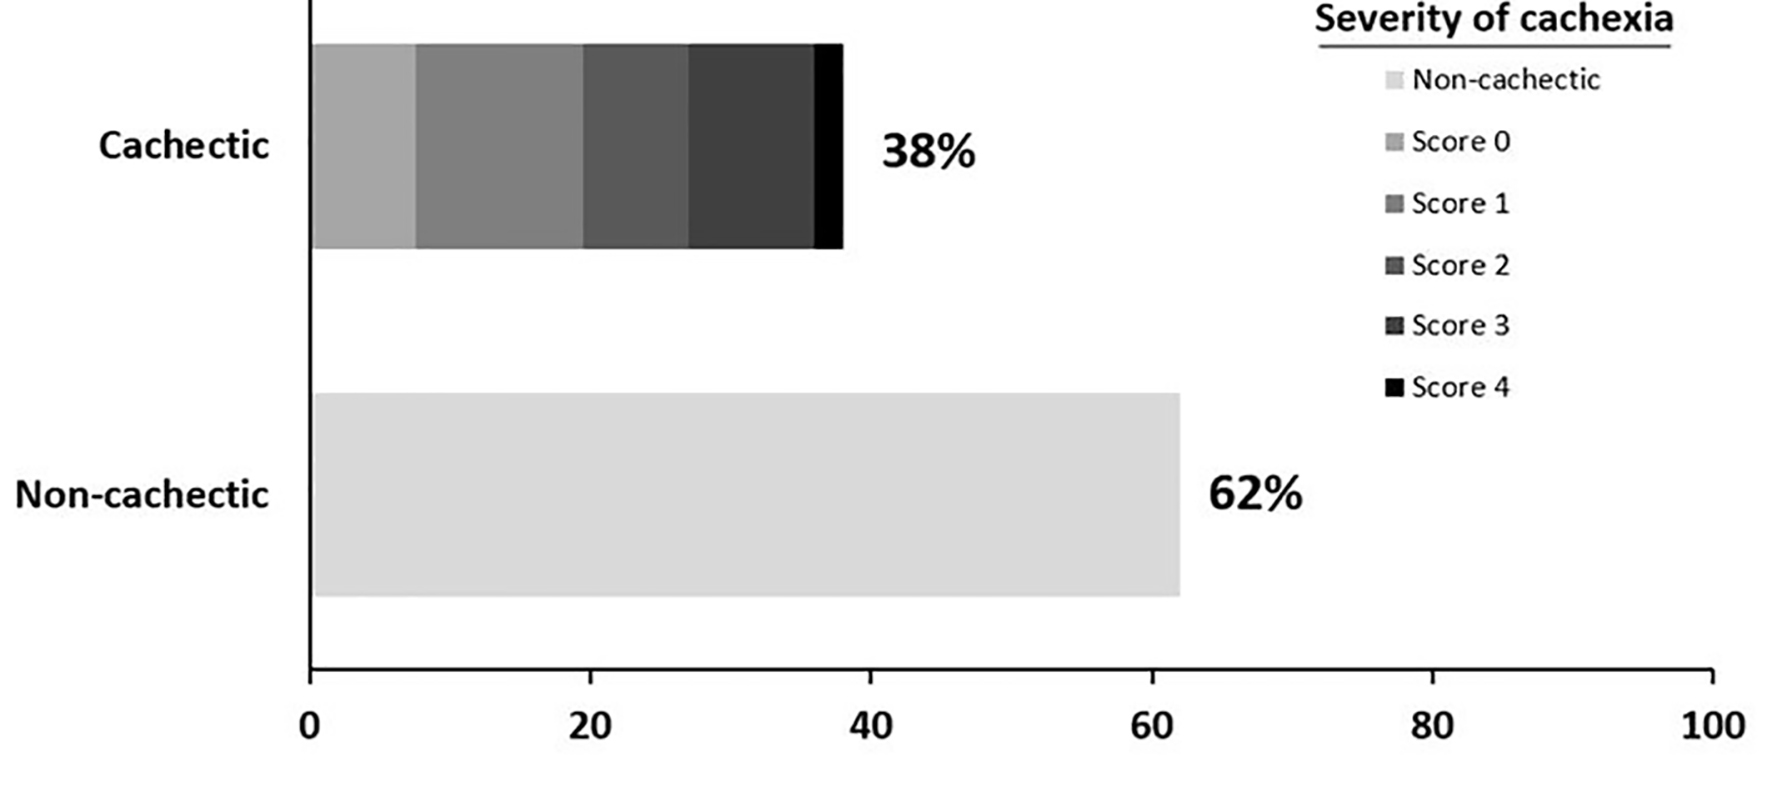
Figure
Tables
Cachexia cohort (n = 145) | |||
---|---|---|---|
n (%) | Median (IQR) | Range | |
*For all lymphomas. BMI: body mass index; CKD-EPI: chronic kidney disease epidemiology collaboration; CRP: C-reactive protein; FLIPI: follicular lymphoma international prognostic index; HL: Hodgkin lymphoma; IPI: international prognostic index for other lymphoma; IQR: interquartile range; ISS: international scoring system for multiple myeloma; NHL: non-Hodgkin lymphoma; MIPI: mantle cell international prognostic index; PCLI: plasma cell labeling index. | |||
Age at diagnosis (years) | - | 62.4 (48.0 - 70.9) | 20.0 - 90.6 |
Male sex | 89 (61) | - | |
Weigh at diagnosis (kg) | - | 71.0 (60.0 - 82.0) | 40.7 - 116.8 |
Height (cm) | - | 170.0 (164.0 - 176.0) | 145.0 - 197.0 |
BMI at diagnosis | - | 24.3 (21.5 - 27.6) | 16.2 - 39.4 |
Tobacco status | |||
Never smoked | 66 (45.5) | - | |
Old smoker | 55 (38) | - | |
Actual smoker | 24 (16.5) | - | |
Hemoglobin (g/L) | 143 (99) | 13.0 (11.5 - 14.1) | 7.5 - 17.4 |
Total proteins (g/L) | 122 (84) | 71.5 (68.0 - 76.0) | 38.0 - 106.0 |
Albumin (g/L) | 122 (84) | 40.2 (36.1 - 42.9) | 17.1 - 48.6 |
CRP (mg/L) | 114 (79) | 5.0 (2.1 - 18.4) | 0.3 - 245.7 |
Creatinine (µmol/L) | 141 (97) | 73.0 (60.0 - 86.0) | 44.0 - 256.0 |
CKD-EPI (mL/min/1.73 m2) | 140 (97) | ||
< 60 | 19 (14) | - | |
> 120 | 16 (11) | - | |
60 - 120 | 100 (71) | 62.4 (48.9 - 70.9) | 20.0-90.6 |
Pathology | |||
HL | 28 (19) | - | |
NHL | 86 (59) | - | |
Myeloma | 31 (22) | - | |
Lymphoma | |||
Ann Arbor stage* I-II | 37/97 | - | |
FLIPI < 2 | 8/13 | - | |
MIPI < 3 | 3/6 | - | |
IPI < 3 | 18/29 | - | |
Myeloma | |||
ISS index I | 16/25 | - | |
PCLI (%) | 24 | 0.23 (0.10 - 0.61) | |
Ratio tumoral/normal plasmocytes | 27 | 22.8 (6.4 - 49.0) |
Original data | Bootstrap analysis (1,000 replicates) | ||
---|---|---|---|
OR (95% CI) | P | Mean OR (95% CI) | |
*For all lymphomas. CI: confidence interval; CRP: C-reactive protein; DLBCL: diffuse large B-cell lymphoma; FLIPI: follicular lymphoma international prognostic index; IPI: international prognostic index for other lymphoma; ISS: international scoring system for multiple myeloma; HL: Hodgkin lymphoma; MIPI: mantle cell international prognostic index; NHL: non-Hodgkin lymphoma; OR: odds ratio; PCLI: plasma cell labeling index. | |||
Total proteins > 72.5 g/L, n = 54/122 | 1.62 (0.77 - 3.47) | 0.208 | 1.48 (1.38 - 1.58) |
Albumin > 41.3 g/L, n = 43/122 | 1.21 (0.56 - 2.65) | 0.635 | 1.39 (1.29 - 1.49) |
CRP > 54.0 mg/L, n = 16/114 | 5.94 (1.55 - 39.14) | 0.023 | 8.17 (3.44 - 19.41) |
Hemoglobin > 12.0 g/L, n = 90/143 | 1.39 (0.69 - 2.79) | 0.353 | 1.14 (1.03 - 1.27) |
Creatinine > 93.5 µmol/L, n = 26/141 | 0.30 (0.12 - 0.73) | 0.009 | 0.78 (0.64 - 0.96) |
Pathology | |||
HL, n = 30 | Ref | NA | |
NHL, n = 84 | 0.45 (0.17 - 1.16) | 0.098 | NA |
Myeloma, n = 31 | 0.37 (0.12 - 1.11) | 0.077 | NA |
Treatment per pathology | |||
HL, n = 30 | Ref | NA | |
DLBCL, n = 35 | 0.36 (0.12 - 1.06) | 0.063 | NA |
Other lymphoma, n = 49 | 0.52 (0.19 - 1.46) | 0.217 | NA |
Myeloma, n = 31 | 0.34 (0.12 - 1.11) | 0.077 | NA |
Lymphoma | |||
Ann Arbor stage* I-II, n = 37/97 | 1.15 (0.49 - 2.73) | 0.752 | 1.37 (1.26 - 1.49) |
FLIPI < 2, n = 8/13 | 0.36 (0.01 - 10.68) | 0.509 | NA |
MIPI < 3, n = 3/6 | 6.29 × 10⁸ (0 - NA) | 0.997 | NA |
IPI < 3, n = 18/29 | 0.38 (0.08 - 1.65) | 0.202 | 0.74 (0.52 - 1.06) |
Myeloma | |||
ISS index I, n = 16/25 | 2.89 (0.24 - 67.90) | 0.414 | NA |
PCLI < 0.63 (%), n = 18/24 | 0.20 (0.01 - 1.58) | 0.142 | NA |
Ratio tumoral/normal plasmocytes < 8.15 , n = 9/27 | 0.51 (0.09 - 2.57) | 0.350 | 0.76 (0.47 - 1.24) |