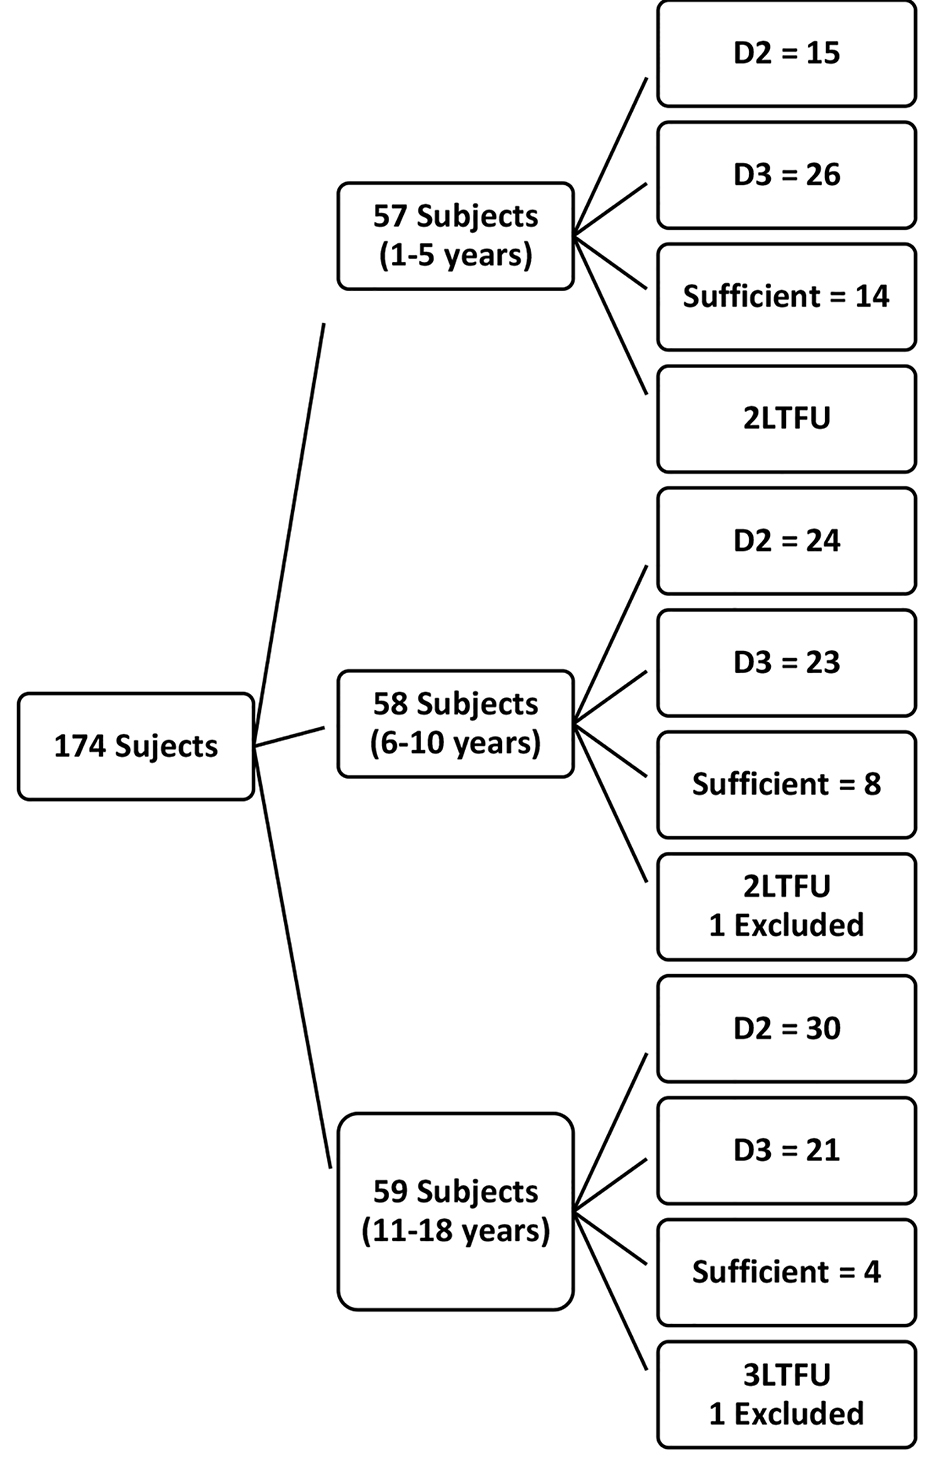
Figure 1. Flow chart of recruited subjects.
| Journal of Hematology, ISSN 1927-1212 print, 1927-1220 online, Open Access |
| Article copyright, the authors; Journal compilation copyright, J Hematol and Elmer Press Inc |
| Journal website https://www.thejh.org |
Original Article
Volume 10, Number 3, June 2021, pages 114-122
Comparative Effectiveness of a Six-Week Treatment Course of Vitamin D2 and D3 in Children With Sickle Cell Anemia in Steady State With Hypovitaminosis D: A Randomized Clinical Trial
Figures
Tables
| Vitamin D2 | Vitamin D3 | U-value | P-value | |
|---|---|---|---|---|
| U-value: Mann-Whitney test was used for comparison as variables were not normally distributed. IQR: interquartile range; 25(OH)D: 25-hydroxyvitamin D. | ||||
| Baseline | ||||
| Median (IQR) | 38.87 (28.6 - 45.6) | 38.27 (30.6 - 48.0) | -0.042 | 0.966 |
| Range | 21.18 - 73.31 | 18.12 - 66.90 | ||
| Post intervention | ||||
| Median (IQR) | 53.24 (45.3 - 70.0) | 54.77 (40.4 - 79.7) | 0.966 | 0.940 |
| Range | 26.51 - 189.10 | 24.27 - 146.90 | ||
| Change from baseline, median (IQR) | U-value | P-value | |
|---|---|---|---|
| Kruskal-Wallis analysis was used for age groups and social class, while Mann-Whitney test was used for gender because the variables were not normally distributed. IQR: interquartile range; 25(OH)D: 25-hydroxyvitamin D. | |||
| Age group (years) | 8.099 | 0.017 | |
| 1 - 5 | 27.37 (9.7 - 79.4) | ||
| 6 - 10 | 15.94 (8.7 - 33.1) | ||
| 11 - 18 | 16.03 (1.5 - 30.2) | ||
| Gender | -0.433 | 0.665 | |
| Male | 16.48 (7.4 - 37.7) | ||
| Female | 17.05 (5.3 - 33.4) | ||
| Social class | 0.547 | 0.761 | |
| Upper | 15.63 (9.1 - 37.8) | ||
| Middle | 17.69 (7.8 - 33.4) | ||
| Lower | 17.10 (4.9 - 32.6) | ||
| Change from baseline, median (IQR) | U-value | P-value | |
|---|---|---|---|
| BMI: body mass index; IQR: interquartile range; 25(OH)D: 25-hydroxyvitamin D. | |||
| Weight for length | |||
| Wasting | 12.8 (10.3) | -0.934 | 0.403 |
| No wasting | 27.8 (11.5 - 77.2) | ||
| Weight for age | |||
| Underweight | 12.67 (11.3 - 24.2) | -0.633 | 0.545 |
| Normal weight | 18.81 (8.7 - 41.6) | ||
| Length/height for age | |||
| Stunting | 8.61 (1.6 - 17.7) | -1.906 | 0.057 |
| No stunting | 17.9 (7.4 - 35.6) | ||
| BMI for age | |||
| Thinness | 16.9 (8.8 - 36.4) | 0.326 | 0.850 |
| Normal | 17.9 (9.05 - 33.5) | ||
| Overweight/obese | 6.7 (2.07) | ||
| Change in vitamin D status | D2 | D3 | Total | χ2 | P-value |
|---|---|---|---|---|---|
| *Fisher exact test was performed because the figures were small. | |||||
| From deficient | n = 56 | n = 54 | n = 110 | ||
| To sufficient | 8 (14.2) | 15 (27.8) | 23 (20.9) | 2.56 | 0.11 |
| To insufficient | 24 (42.9) | 11 (20.4) | 35 (31.8) | 7.17 | 0.007 |
| Remained deficient | 24 (42.9) | 28 (51.9) | 52 (47.3) | 1.43 | 0.23 |
| From insufficient | n = 9 | n = 10 | n = 19 | ||
| To sufficient | 3 (33.3) | 5 (50.0) | 8 (42.1) | 0.65* | |
| Remained insufficient | 6 (66.7) | 5 (50.0) | 11 (57.9) | ||
| D2 | D3 | t-value | P-value | |
|---|---|---|---|---|
| Baseline | ||||
| Mean ± SD | 8.85 ± 1.2 | 8.86 ± 1.2 | 0.735 | 0.464 |
| Range | 6.85 - 11.17 | 6.76 - 11.21 | ||
| Post treatment | ||||
| Mean ± SD | 8.95 ± 0.7 | 9.04 ± 0.7 | -0.733 | 0.465 |
| Range | 7.16 - 10.05 | 7.19 - 11.23 |
| D2 | D3 | U-value | P-value | |
|---|---|---|---|---|
| Mann-Whitney U test was used for analysis as variables were not normally distributed. IQR: interquartile range. | ||||
| Baseline | ||||
| Median (IU/L) | 283.4 | 299.7 | -0.316 | 0.752 |
| IQR | 246.6 - 367.9 | 247.9 - 343.3 | ||
| Post-treatment | ||||
| Median (IU/L) | 228.9 | 228.9 | -0.606 | 0.544 |
| IQR | 201.6 - 267.1 | 185.3 - 267.1 | ||