

| Journal of Hematology, ISSN 1927-1212 print, 1927-1220 online, Open Access |
| Article copyright, the authors; Journal compilation copyright, J Hematol and Elmer Press Inc |
| Journal website https://www.thejh.org |
Original Article
Volume 12, Number 5, October 2023, pages 208-214

Validation of the New MINI-CUBE for Clinic Determination of Erythrocyte Sedimentation Rate
Flaminia Tomassettia, b, Martina Pelagallia, b, Eleonora Nicolaia, b, Serena Sarubbia, b, Cinzia Calabresea, b, Alfredo Giovannellia, b, Silvia Codellaa, b, Gemma Violab, Daniela Diamantic, Renato Massouda, b, Sergio Bernardinia, b, Massimo Pieria, b, d
aDepartment of Experimental Medicine, University of Rome “Tor Vergata”, Rome 00133, Italy
bDepartment of Laboratory Medicine, “Tor Vergata” University Hospital, Rome 00133, Italy
cResearch and Development Department, DIESSE Diagnostica Senese Spa, Monteriggioni 53035, Siena (SI), Italy
dCorresponding Author: Massimo Pieri, Department of Experimental Medicine, University of Rome “Tor Vergata”, Rome 00133, Italy
Manuscript submitted July 8, 2023, accepted October 2, 2023, published online October 25, 2023
Short title: Method Validation of New ESR Analyzer
doi: https://doi.org/10.14740/jh1165
| Abstract | ▴Top |
Background: Erythrocyte sedimentation rate (ESR) indirectly measures blood fibrinogen, and it is altered by all those pathological conditions that modify the aggregation of red blood cells. The international guidelines by the International Council for Standardization in Hematology (ICSH) define the Westergren method as the gold standard for ESR, although it is completely operator-dependent, time-consuming, and requires a patient’s blood consumption. Therefore, the validation of new ESR analyzers is needed. The aim of this study is the validation of a new automated ESR analyzer, MINI-CUBE (DIESSE, Diagnostica Senese, Italy).
Methods: The samples (n = 270) were collected at the University Hospital of the University of Rome Tor Vergata. A comparison between the automated instrument and the gold standard was performed. Statistical analyses were processed by MedCalc software.
Results: The comparison analysis performed on the overall samples reported a good agreement, showing a Spearman rank correlation coefficient of 0.94 (P < 0.001), compared to the Westergren test. The Bland-Altman analysis showed a mean bias of 1.5 (maximum (max.):19.6; minimum (min.): -16.6). Inter-run (level 1 coefficient of variation (CV): 4.9%; level 2 CV: 0.8%), intra-run (level 1 CV: 21.1%; level 2 CV: 3.2%), and inter-instrument (level 1 CV: 27.1%; level 2 CV: 5.6%) precision were also assessed. The hematocrit value did not interfere with the analysis: Spearman rank correlation coefficient of 0.929 (P < 0.001); mean bias of 1.3 (max.:18.3; min.: -15.6).
Conclusions: Overall results from MINI-CUBE asserted a good correlation rate with the gold standard, and it could be considered an accurate, and objective alternative for the Westergren test.
Keywords: Erythrocyte sedimentation rate; Blood sedimentation; Method validation
| Introduction | ▴Top |
Erythrocyte sedimentation rate (ESR) is a simple hematology test that measures the “length of sedimentation reaction of blood (LSRB)” [1], i.e., the rate at which red blood cells separate from anticoagulated whole blood in a standardized tube over a specified time. This test is widely used in clinical laboratories, and it is highly requested for diagnosis to evaluate the inflammation rate in the acute response [2]. This phenomenon is a physiological process wherein an increase in the blood of serum proteins, particularly globulins (as immunoglobulins) or fibrinogen, is often observed: the red blood cells lose their repulsive forces and tend to stack together in long chains, known as “rouleaux formation” [3]. Consequently, the rate of red cell sedimentation is promoted, and the ESR increases [4]. So, ESR depends on any pathological condition that alters red blood cell aggregation and is a laboratory test used as a general marker for changes in normal physiological conditions, particularly as a marker of inflammation [5, 6].
Therefore, the ESR, an easily reproducible and low-cost test, can help in the diagnosis of pathological conditions associated with acute and chronic inflammation, including infections, cancers, and autoimmune diseases [7, 8]. Despite being recently considered redundant and nonspecific, the ESR is still a helpful biomarker for monitoring immunological status and inflammatory disorders [8]. Furthermore, ESR has been shown as a prognostic marker in stroke for cardiovascular disease and as a predictor of mortality [9].
The international guidelines defined by the International Council for Standardization in Hematology (ICSH) define the Westergren method as the reference method for measuring ESR. ESR is determined by the distance (in millimeters) of the precipitation due to the gravity of red blood cells in anticoagulated sodium citrate blood up to the bottom of a standardized capillary tube over 60 min [10]. The tube used for the test is called the Westergren tube [11]. However, since this method is completely manual and involves the patient’s blood consumption, in the last decades, many evaluations of new ESR analyzers using alternative methods have been available to reduce operator-dependent validity/subjectivity and executive time. Some of these are based on the automatism of the Westergren method, while the latter technologies measure the ESR directly from a standard ethylenediaminetetraacetic acid (EDTA) anticoagulated blood tube [12]. This allows using undiluted EDTA samples, without sample consumption for more handleability, practicability, closed sample manipulation, and shorter turnaround time (TAT) [9, 13]. One of these automated instruments of various load capacities and analyses for the determination of ESR is proposed by DIESSE (Diagnostica Senese, Monteriggioni, Italy).
The aim of this study is the method validation of a novel ESR analyzer, the MINI-CUBE (DIESSE Diagnostica Senese, Italy), throughout a comparison study with the gold standard, the Westergren test, following the ICSH recommendations [14]. Precision, stability, and interference studies were conducted to assess the performance of the new instrument.
| Materials and Methods | ▴Top |
Patients
Two hundred seventy blood EDTA samples (129 females and 141 males) were collected from routine leftover tubes from patients of the Tor Vergata University Hospital, including 31 samples from cancer patients recovered in the Hematology Department with lymphoproliferative or myeloproliferative diseases, to expand the positive inflammatory scenario. The samples were analyzed up to 3 h after collection and stored at 4 - 8 °C, altered (hemolytic, lipemic, jaundiced, insufficient, and not correctly stored) samples were excluded by the study to not affect the results. The study was approved by the Ethics Committee (R.S.202/19) of the hospital and conducted according to the revised Declaration of Helsinki (2013).
Study design
The study was focused firstly on the determination of the ESR in samples from various departments and with different hematocrit values and then on the evaluation of interferents, precision, and stability study. Furthermore, the reference intervals were verified by collecting as few as 20 samples from qualified reference individuals, as following the CLSI EP 28-A3: 2010 guidelines [15].
Samples having low ESR (< 20 mm/h), intermediate ESR (21 - 60 mm/h), and high ESR (> 61 mm/h) were analyzed to assess the correlation of MINI-CUBE with the gold standard, and to establish the accuracy of the test. Also, leftover samples of patients affected by multiple myeloma, monoclonal and polyclonal gammopathies, lymphomas, bone tumors, and anemia, were analyzed to evaluate the performance of the MINI-CUBE in chronic inflammation conditions, compared to the Westergren test.
For the stability study, 12 samples, of which four with low ESR (< 20 mm/h), four with intermediate ESR (21 - 60 mm/h), and four with high ESR (> 61 mm/h) levels, were processed at the time of the blood collection (T0), after 1 h (T1), after 2 h (T2), after 3 h (T3), after 5 h (T4) and after 24 h. The specimens were stored at 4 °C between analyses.
The ESR was also evaluated in samples with interferences, such as hemolysis, icterus, and lipemia. The interferences were defined by analyzing 35 patient EDTA samples that have serum index analyzed by Alinity (Abbott, Chicago, USA), from the same venipuncture.
Lastly, the intra-run, inter-run, and inter-instrument precision were determined.
Westergren test
Venous EDTA-anticoagulated blood sample (1 mL) was mixed and diluted with 0.250 mL sodium citrate. Blood was drawn into the standardized Westergren tube to the 200 mm mark, which was placed in a strictly vertical position rack for 1 h at room temperature. To conclude, the visual determination of the result was defined by the mark corresponding to the upper limit of the erythrocyte sedimentation.
The Westergren method was performed manually according to the ICSH’s recommendations [11], within the 4 h of blood sampling.
MINI-CUBE test
The test was performed on blood samples collected in the EDTA blood tubes, with any pre-treatment (dilution with sodium citrate). The analyzer can measure ESR directly from the capped EDTA tube on four simultaneous and random-access samples, for an executive period of 20 min of optical reading in all three phases of erythrocyte sedimentation: aggregation, sedimentation, and packing.
The samples, before the analysis, were gently mixed turning them upside down, and put inside the instrument, which allows the continuous loading of samples for up to four analyses simultaneously. After 20 min, the optical unit, consisting of four pairs of optoelectronic elements in a solid state (photodiode + phototransistor), automatically read the distance from the top of the plasma level to the upper limit of the erythrocyte sediment, giving the results in mm/h.
Statistics
Firstly, tests for normality were performed by implementing Kolmogorov-Smirnov tests with a confidence interval (CI) of 95% to assess if the collected data were parametric or non-parametric. Secondly, once the distribution of the dataset was normal, Spearman’s rank correlation coefficient was adopted to measure the association between two ranked variables. Data were considered using standard deviation (SD), Spearman rank correlation coefficient (r2), and equations of linear regression. Passing-Bablok regression analysis was used to compare MINI-CUBE to the Westergren test, while the Bland-Altman test was performed to determine the agreement between the two methods and to investigate any possible relationship of the discrepancies between the measurements and the true value (i.e., proportional bias). Meanwhile, a multiple linear regression was applied in the hematocrit study to evaluate the interference. ESR was considered the dependent variable and the hematocrit values as the explanatory variable.
Repeatability and reproducibility were estimated using five patient samples, collected from the laboratory’s routine and not included in the correlation analysis, with ESR values belonging to each range defined in the study design and re-analyzed for six times.
The intra-run precision was calculated by means of quintuplicate measurements on each level of the quality control ESR control Cube (DIESSE, Diagnostica Senese). The inter-run precision was calculated by means of quintuplicate measurements on each level of the quality control per day over 5 days, following the Clinical and Laboratory Standards Institute (CLSI) EP15-A3 protocol [16]. The inter-instrument precision was assessed by applying the intra-run protocol for each of the three instruments. The precision results obtained were compared to those claimed by the manufacturer.
All data were examined using Med Calc Ver.18.2.18 (MedCalc Software Ltd, Ostend, Belgium).
The statistical significance level established for all tests performed was P < 0.05.
| Results | ▴Top |
In our study, 270 samples were compared with the gold standard, Westergren test, to evaluate the ESR; nine out of 270 were excluded (n = 261) through outliers’ detection applying the Grubb’s test. Moreover, 20 samples from qualified reference individuals were tested and the reference intervals were confirmed for all the patients (P = not significant (NS)).
Figure 1a exhibits a linear regression that shows a good correlation between the two methods with a Spearman coefficient (R2) of 0.94 (95% CI: 0.928 - 0.955; P < 0.001). Figure 1b reports the Bland-Altman analysis showing the mean bias of 1.5 (upper limit of 19.6; lower limit of -16.6). According to the ICSH guidelines, the samples were divided into three analytical ranges obtained by the Westergren analysis: low ESR values (under 20 mm/h), medium ESR values (21 - 60 mm/h), and high ESR values (over 60 mm/h). The Spearman coefficient (R2) for each category was: 0.83 (N: 141; 95% CI: 0.77 - 0.87; P < 0.001), 0.74 (N: 61; 95% CI: 0.60 - 0.84; P < 0.001), 0.62 (N: 44; 95% CI: 0.39 - 0.78; P < 0.001). Table 1 shows the coefficient of variation (CV%), evaluated through the repetitive measurements of quality control ESR control Cube, with the CV declared by the manufacturer. No significant difference was observed between the CVs of the two methods (P > 0.05 (NS)).
 Click for large image | Figure 1. Linear regression and bias plots for the methods comparison (n = 261). (a) Passing-Bablok regression analysis between MINI-CUBE vs. Westergren test, defined by the equation y = 1.00 + 1.00x, intercept A 1.00 (95% CI: 0.00 - 2.00), slope B 1.00 (95% CI: 0.98 - 1.04). It was evaluated R2 of 0.94 (95% CI: 0.928 - 0.955; P < 0.001). (b) Bland-Altman test defined by the Westergren test and MINI-CUBE results (y-axis) and the mean of the two methods. The dotted lines denote the limits of the agreement (max.:19.6; min.: -16.6), and the continued line denotes the bias of 1.5. CI: confidence interval; max.: maximum; min.: minimum; SD: standard deviation. |
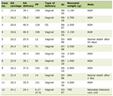 Click to view | Table 1. Intra-Run, Inter-Run, and Inter-Instrument Precision Analysis With Quality Control ESR Control Cube |
Also, it was estimated the precision for MINI-CUBE on 12 leftover patients’ blood samples with different values of ESR, divided into four samples with low value (ESR < 10 mm/h), five samples with medium value (ESR: 11 - 60 mm/h) and three samples with high value (ESR > 60 mm/h). The repeatability and the reproducibility coefficients were lower than 10%, as reported in Table 2.
Click to view | Table 2. Precision Analysis With Leftover Samples, Through the Measure of Mean, Repeatability, and Reproducibility |
The hematocrit study was assessed in 109 samples, selected from the overall for the normal hematocrit value (36-44%), evaluated by the automated analyzer BC 6800 PLUS (Mindray Bio-Medical Electronics Co., Ltd, Shenzen, China). A good correlation between the two methods was estimated (Fig. 2): R2: 0.929 (95% CI: 0.898 - 0.951; P < 0.001). Furthermore, the results of the multiple linear regression resulted in an optimized model consisting of an adjusted R2 (R2 adj) value of 0.0014, and a coefficient of multiple correlation (R) of 0.061, indicating a very weak correlation between the data and the hematocrit interference. A very weak collective non-significant effect between the MINI-CUBE, the Westergren method, and the hematocrit value that was assessed (F (1, 420) = 0.83, P = 0.363, R2 = 0, R2 adj = 0).
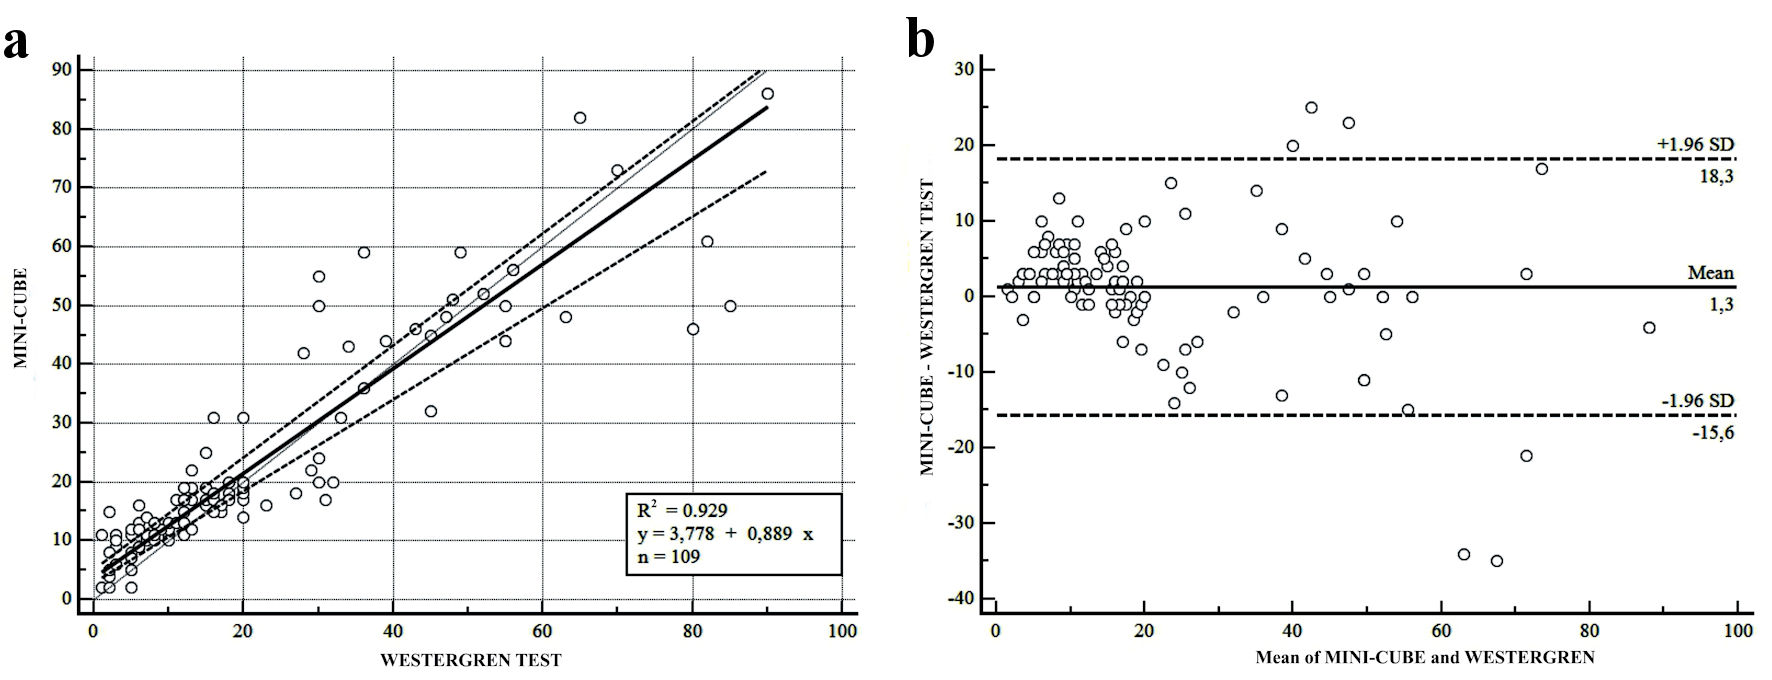 Click for large image | Figure 2. Linear regression and bias plots for the methods comparison for all the samples with normal hematocrit (Hct) (36% - 44%) (n = 109). (a) Passing-Bablok regression analysis between MINI-CUBE vs. Westergren test, defined by the equation y = 3.778 + 0.889x, intercept 3.778 (95% CI: 0.00 - 5.143), slope 0.889 (95% CI: 0.777 - 5.954). It was evaluated R2 of 0.929 (95% CI: 0.898 - 0.951; P < 0.001). (b) Bland-Altman test defined by the Westergren test and MINI-CUBE results (y-axis) and the mean of the two methods. The dotted lines denote the limits of the agreement (max.:18.3; min.: -15.6), and the continued line denotes the bias of 1.3. CI: confidence interval; max.: maximum; min.: minimum; SD: standard deviation. |
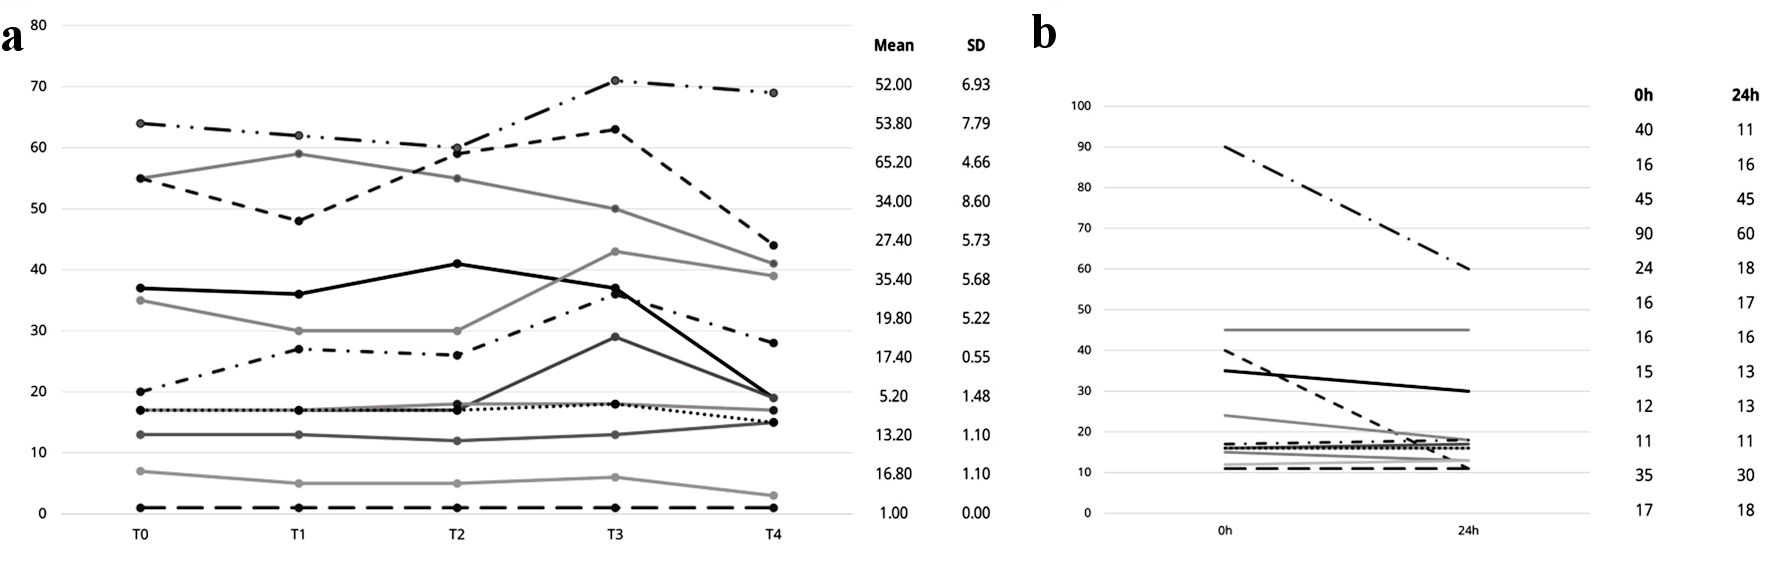
The stability assessment was evaluated: samples with low ESR levels were stable for up to 5 h (T4), while the samples with intermediate and high ESR levels were stable up to 3 h (T3) after the blood collection. The same trend was confirmed for the analysis after 24 h (Supplementary Material 1, www.thejh.org).
Finally, 11 samples with hemolysis (hemolytic index > 33 mg/dL Hb), 13 with icterus (jaundice index > 2 mg/dL), and 10 with lipemia (lipemic index > 68 mg/dL), defined by the serum index of the clinical chemistry analysis, were collected. For each index, Passing-Bablok regression analysis and Bland-Altman test were performed. Hemolysis interference assessment included analysis of routine hemolyzed samples without additional hemolysis induction. Results of the assessment of hemolysis, icterus, and lipemia interference are presented in Table 3.
Click to view | Table 3. Results of Hemolysis Icterus, and Lipemia Interference on ESR Results |
| Discussion | ▴Top |
ESR represents an important index of inflammation and, due to its simplicity and low cost, it is a widely used test in clinical laboratories [17]. Furthermore, it is a useful exam to support the diagnosis and monitor the course and therapeutic response of specific pathologies, including infection, tumor, and autoimmune diseases. In light of these reasons, new and rapid tests are extremely helpful, and the results obtained from this study confirmed the MINI-CUBE as a possible candidate.
Overall, the results were comparable with the gold standard, the Westergren test. The linear regression and Passing-Bablok analysis showed optimal agreement between the two methods (R2 = 0.94), as well as the Bland-Altman analysis. The observed bias means resulting from this statistical approach can be considered acceptable from a clinical point of view. These data suggest that the new alternative ESR analyzer could be more rapid than the classic one, because in just 20 min it can give accurate results, and provide an objective ESR analysis, and due to the automatic reader, avoiding subjective interpretation and leading to harmonization according to the ICSH [12].
However, consistent with previous findings [13, 18], samples with low ESR levels correlated better than high ESR levels samples, as can be seen in Figure 1, probably due to the non-dilution with sodium citrate of the samples, as in the Westergren test. The high levels of ESR results obtained by MINI-CUBE, through the mathematical calculation of the optical distance of the red blood cell aggregation and the top of the plasma, indicated a slight difference with the high levels of ESR results obtained from the gold standard [11, 19, 20]; anyhow, despite the larger bias, the lower correlation for high ESR values do not influence the clinical evaluation. It was observed that the ESR high levels were predominantly from samples from cancer patients, due to the inflammatory status generated by the tumor microenvironment. Many studies found that high ESR levels reveal the presence of growth-related inflammation and reflect the severity of systemic inflammation in cancer patients [6, 21].
In the hematocrit study, a larger dispersion of results was assessed between the two methods and the hematocrit values, revealing no interference [22, 23], despite other studies and the guidelines [14], where low and normal hematocrit values interfere significantly with the result of ESR. Likewise, an interfering investigation was conducted to assess other eventual clinical interferences such as lipemia, hemolysis, and jaundice, revealing no significant results [18].
Furthermore, through the repeatability (RC) and the reproducibility coefficients (RDC), the precision analysis was assessed. In the intra- and inter-run precision analysis, no difference between the %CVs was declared by the manufacturers and the %CVs calculated for ESR quality control (QC) level 2, meanwhile, was noted to have a difference for the %CVs for ESR QC level 1. However, although the ESR QC level 1 %CVs were high, they were caused by millesimal differences from low ESR values, as can be seen by the mean and the SD; therefore, the inaccuracy was minimal, and the systemic bias was very low. These results and considerations were in agreement with precedent studies, where the control low-level CVs were also high [24, 25].
The MINI-CUBE ESR analyzer was designed for more flexibility in clinical facilities and small laboratories. It can simultaneously evaluate up to four samples, even when started at different times. Anyhow, one limit of this instrument is the condition to perform the test within 3 h from blood collection, even if stored at refrigerated temperature, and the low workload that it can support.
In conclusion, our study demonstrates the optimal performance of the MINI-CUBE, showing valid results for precision and accuracy. Anyhow, our research should be detailed also in another population and should be implemented with interference studies on anemia, fibrinogen, and paraproteinemia. The new tool is easy to use, and measurements require only 20 min, then it could be performed by professional laboratory personnel or by non-specialized personnel either in a laboratory or at a remote site, such as a private doctor’s office or in the emergency unit. Also, based on the optical method, the test does not consume the sample, without any waste production or exposure to “possibly risk-infected” human blood.
| Supplementary Material | ▴Top |
Suppl 1. (a) Evaluation of stability study from blood collection time up to 5 h after. ESR values are expressed as mean and SD. (b) Values and evaluation of stability study from blood collection time up to 24 h after. (T0: fresh samples; T1: after 1 h; T2: after 2 h; T3: after 3 h; T4: after 5 h).
Acknowledgments
The authors thank all the staff of the University Hospital of the University of Rome Tor Vergata, involved in the present study.
Financial Disclosure
None to declare.
Conflict of Interest
The authors declare the following financial interests/personal relationships which may be considered as a potential competing interest: DIESSE Diagnostica Senese S.p.A. Societa Benefit provided the MINI-PET® ESR instrument. Dr. Daniela Diamanti is a DIESSE Diagnostica Senese S.p.A. Societa Benefit member. None of the other authors has any other financial or personal relationship that could inappropriately influence or bias the content of the paper.
Informed Consent
Not applicable.
Author Contributions
P.M., B.S., and D.D. conceived the original idea. T.F., P.M., S.S., G.A., C.C., and C.S. performed the data acquisition and data analysis. N.E., G.V., and M.R. contributed to the interpretation of data. T.F., P.M., and G.A. drafted the manuscript with support from N.E., P.M., D.D., and B.S. All authors contributed to the design of the work and critically revised the work and approved the final manuscript.
Data Availability
The data that support the findings of this study are available from the corresponding author upon reasonable request.
| References | ▴Top |
- Piva E, Sanzari MC, Servidio G, Plebani M. Length of sedimentation reaction in undiluted blood (erythrocyte sedimentation rate): variations with sex and age and reference limits. Clin Chem Lab Med. 2001;39(5):451-454.
doi pubmed - Curvers J, Kooren J, Laan M, van Lierop E, van de Kerkhof D, Scharnhorst V, Herruer M. Evaluation of the Ves-Matic Cube 200 erythrocyte sedimentation method: comparison with Westergren-based methods. Am J Clin Pathol. 2010;134(4):653-660.
doi pubmed - Langstroth L. Blood viscosity: I. conditions affecting the viscosity of blood after withdrawal from the body. J Exp Med. 1919;30(6):597-606.
doi pubmed pmc - Abramson N. Rouleaux formation. Blood. 2006;107(11):4205.
pubmed - Grzybowski A, Sak J. A short history of the discovery of the erythrocyte sedimentation rate. Int J Lab Hematol. 2012;34(4):442-444.
doi pubmed - Markanday A. Acute Phase Reactants in Infections: Evidence-Based Review and a Guide for Clinicians. Open Forum Infect Dis. 2015;2(3):ofv098.
doi pubmed pmc - Lacy M. Review of inflammatory biomarkers in hospitalized adults with suspected infection. The Southwest Respiratory and Critical Care Chronicles. 2018;6:4-9.
doi - Litao MK, Kamat D. Erythrocyte sedimentation rate and C-reactive protein: how best to use them in clinical practice. Pediatr Ann. 2014;43(10):417-420.
doi pubmed - Perovic E, Bakovic L, Valcic A. Evaluation of Ves-Matic Cube 200—an automated system for the measurement of the erythrocyte sedimentation rate. Int J Lab Hematol. 2010;32(1 Pt 2):88-94.
doi pubmed - Zini G, d'Onofrio G, Erber WN, Lee SH, Nagai Y, Basak GW, Lesesve JF, et al. 2021 update of the 2012 ICSH Recommendations for identification, diagnostic value, and quantitation of schistocytes: Impact and revisions. Int J Lab Hematol. 2021;43(6):1264-1271.
doi pubmed - Tishkowski K, Gupta V. Erythrocyte Sedimentation Rate. In: StatPearls [Internet]. Treasure Island (FL): StatPearls Publishing; 2023.
pubmed - Kratz A, Plebani M, Peng M, Lee YK, McCafferty R, Machin SJ, International Council for Standardization in H. ICSH recommendations for modified and alternate methods measuring the erythrocyte sedimentation rate. Int J Lab Hematol. 2017;39(5):448-457.
doi pubmed - Pieri M, Pignalosa S, Perrone MA, Russo C, Noce G, Perrone A, Terrinoni A, et al. Evaluation of the Diesse Cube 30 touch erythrocyte sedimentation method in comparison with Alifax test 1 and the manual Westergren gold standard method. Scand J Clin Lab Invest. 2021;81(3):181-186.
doi pubmed - Clinical and Laboratory Standards Institute. Chapter 5 - Principle. CLSI H02A-5 Vol.31 No.11 - Procedures for ESR Test: Approved Standard - 5th Edition. 2011.
- Clinical and Laboratory Standards Institute. CLSI EP 28-A3: 2010 EP28-A3c - Defining, Establishing, and Verifying Reference Intervals in the Clinical Laboratory; Approved Guideline - Third Edition. 2010.
- Clinical and Laboratory Standards Institute. CLSI EP15-A3 - User verification of precision and estimation of bias; Approved Guideline - Third Edition. Wayne, PA, USA. 2014
- Higuchi M, Watanabe N. A rapid and accurate method for estimating the erythrocyte sedimentation rate using a hematocrit-corrected optical aggregation index. PLoS One. 2022;17(7):e0270977.
doi pubmed pmc - Prompetchara E, Nowaratsopon S, Wongkamchai S, Srieakpanit J, Ketloy C. Erythrocyte sedimentation rate measurements using MIX-RATE(R) X20 and VISION A automated analyzers: Method validation and comparison study. Int J Lab Hematol. 2022;44(5):846-853.
doi pubmed - Plebani M, Piva E. Erythrocyte sedimentation rate: use of fresh blood for quality control. Am J Clin Pathol. 2002;117(4):621-626.
doi pubmed - Cicak H, Sonjic P, Simundic AM. Verification of automatic analyzers Roller 20PN and iSED for measuring erythrocyte sedimentation rate. Biochem Med (Zagreb). 2022;32:98-105.
doi - Ohtsu T. [Tumor markers in lymphoproliferative disorders]. Nihon Rinsho. 1996;54(6):1621-1625.
pubmed - Narang V, Grover S, Kang AK, Garg A, Sood N. Comparative analysis of erythrocyte sedimentation rate measured by automated and manual methods in anaemic patients. J Lab Physicians. 2020;12(4):239-243.
doi pubmed pmc - Lapic I, Piva E, Spolaore F, Tosato F, Pelloso M, Plebani M. Automated measurement of the erythrocyte sedimentation rate: method validation and comparison. Clin Chem Lab Med. 2019;57(9):1364-1373.
doi pubmed - Mahlangu JN, Davids M. Three-way comparison of methods for the measurement of the erythrocyte sedimentation rate. J Clin Lab Anal. 2008;22(5):346-352.
doi pubmed pmc - Schapkaitz E, RabuRabu S, Engelbrecht M. Differences in erythrocyte sedimentation rates using a modified Westergren method and an alternate method. J Clin Lab Anal. 2019;33(2):e22661.
doi pubmed pmc
This article is distributed under the terms of the Creative Commons Attribution Non-Commercial 4.0 International License, which permits unrestricted non-commercial use, distribution, and reproduction in any medium, provided the original work is properly cited.
Journal of Hematology is published by Elmer Press Inc.