

| Journal of Hematology, ISSN 1927-1212 print, 1927-1220 online, Open Access |
| Article copyright, the authors; Journal compilation copyright, J Hematol and Elmer Press Inc |
| Journal website http://www.thejh.org |
Original Article
Volume 1, Number 4-5, October 2012, pages 89-92
Do Plasma Cells Affect Hemoglobin and Red Blood Cell Counts in Patients With and Without Myeloma?
Vani Chandrashekar
Department of Hematology, Apollo Hospitals, 21, Greams Lane, Off Greams Road, Chennai, Tamil Nadu, India
Manuscript accepted for publication September 17, 2012
Short title: Plasma Cells Affect
doi: https://doi.org/10.4021/jh38w
| Abstract | ▴Top |
Background: We undertook this study to evaluate if there is any significant correlation between hemoglobin levels, red blood cell (RBC) count, bone marrow normoblast percentage and marrow plasma cell percentage in patients with and without myeloma.
Methods: In this study, we compared hemoglobin level, red blood cell count and bone marrow normoblast percentage with plasma cell percent in 60 patients with and without myeloma (30 with and 30 without myeloma).
Results: There was significant negative correlation for all three in the myeloma group (P values of 0.03, 0.02 and < 0.0001 for hemoglobin, red cell count and normoblast percent respectively). In the non myeloma group significant negative correlation (P = 0.02) was seen only between normoblast and plasma cell percent. The students-t-test between the two groups revealed a significant difference between mean red cell count and normoblast percentage, however the mean hemoglobin was similar. We further sub classified the myeloma group based on hemoglobin level and found that the commonest subgroup had average hemoglobin of 84 g/L.
Conclusions: We conclude that in the non myeloma group there is possibility of plasma cells affecting bone marrow normoblast count. We have also raised the possibility of absence of ineffective erythropoiesis in the myeloma group.
Keywords: Myeloma; Pearsons correlarion; Students-t-test
| Introduction | ▴Top |
Anemia is seen in more than two thirds of patient with myeloma. The reasons for this are diverse, some of which include anemia of chronic disorders, reduced erythropoietin production, reduced sensitivity of erythroid precursors and myeloma cell mediated apoptosis of erythroid progenitors [1].
Reduced number of committed erythroid precursors and suppression of erythropoiesis by Interleukine-6 have been reported to be associated factors [2]. Crowding of marrow by plasma cells and replacement of marrow interferes with hematopoiesis and is also responsible for anemia. A severe normocytic normochromic anemia is seen in more than 20% of patients and is of anemia of chronic disorders type [3]. There is inappropriate erythropoietin secretion, moderate hypoferremia with normal to increased iron stores and defective maturation of erythroid precursors [4]. There is an increase in levels of cytokines such as tumor necrosis factor-α, transforming growth factor-β, interferon-γ, and interleukins 8 and 11 which negatively regulate erythropoiesis by enhancing apoptogenic molecules on erythroid precursors.
We undertook this study to evaluate if there is any significant correlation between hemoglobin levels, red blood cell (RBC) count, bone marrow normoblast percentage and marrow plasma cell percentage in patients with and without myeloma(group 1 and 2) and we compared the two groups.
Fossi A and others reported a negative correlation between hemoglobin and CD-38 positive cells in S-phase (P < 0.001) in myeloma patients with moderate to severe anemia [5].
| Materials and Methods | ▴Top |
We compared 30 samples (FBC and marrow smears) from patients with myeloma- Group 1 (diagnosed between August 2011-May 2012 by biochemical, clinical, pathological evidence or combination) with 30 samples (FBC and marrow smears) collected from patients- Group 2 with no evidence or clinical suspicion of myeloma. This group included patients with unexplained anemias, anemia of chronic disorders, aplastic anemia, pancytopenia, autoimmune hemolytic anemias and lymphomas for staging. Group 1 patients included only patients who were newly diagnosed cases and were not on chemotherapy.
The hemoglobin and RBC counts from both groups were estimated by Advia-2120(Siemens) and LH-750 (Beckman Coulter) analyzer.
Three Leishman stained bone marrow smears were evaluated and an average of three differentials from a 300 cell count was obtained.
Data analysis: Pearsons correlation and students-t-test (assuming unequal variance) was computed on Med Cal software (v12.2.1).
| Observations | ▴Top |
Statistical summary of patients in Group 1: The age range of these patients varied from 35 - 82 years with 20 male and ten female patients. The hemoglobin ranged from 42 - 139 g/L with a mean of 77g/L (normal: males-130 - 170 g/L, females-120 - 150 g/L). The RBC count varied from 1.41 - 4.51 × 10¹²/L (normal: males, 4.5 - 5.5 × 1,012/L, females, 3.8 - 4.8 ×10¹²/L with an average of 2.5 ×10¹²/L (Table 1).
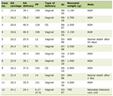 Click to view | Table 1. Summary Statistics of Hemoglobin, RBC Count, Plasma Cells and Normoblasts |
Bone marrow plasma cells varied from 29-94% (normal: 0-3.5%) with a mean of 55%. Bone marrow normoblasts varied from 0.5-29% (5-35%) with an average of 11.75% (Table 1).
The Pearsons coefficient correlation between hemoglobin and percentage of plasma cells was -0.39, between RBC count and plasma cells was -0.40 and between percentage of normoblasts and percentage of plasma cells was -0.75 (Table 2).
Click to view | Table 2. Pearsons Coefficient Correlation in Group 1 and Group 2 |
Statistical summary of patients in Group 2: The age range of these patients varied from 25 - 77 years with 19 male and 11 female patients. The hemoglobin ranged from 56 - 155 g/L with a mean of 88 g/L. The RBC count varied from 1.73 - 5.99 ×10¹²/L with a mean of 3.38 ×10¹²/L (Table 1).
Bone marrow plasma cells varied from 0.5-13% with a mean of 2.56%. Percentage of normoblasts varied from 2 - 74 with a mean of 37.8% (Table 1).
The Pearsons coefficient correlation between hemoglobin and plasma cells was -0.02, between RBC count and plasma cells was -0.08 and between percentage of normoblasts and plasma cells was -0.4139 (Table 2).
Students-t-test comparing Group 1 and Group 2: The t-test was conducted between hemoglobin levels between group 1 (mean: 7.77, standard deviation: 4.87) and group 2 (mean: 8.8, standard deviation: 2.53), RBC counts in group 1 (mean: 2.56, standard deviation: 0.67) and 2 (mean: 3.38, standard deviation: 1.17) and percentage of normoblasts in group 1 (mean: 11.75, standard deviation: 7.42) and group 2 (mean: 37.83, standard deviation: 16.09). The results of the t-test are summarized in Table 3.
Click to view | Table 3. Summary of t-Tests |
Sub classification of Group 1: We could classify our patients in to four subgroups based on hemoglobin levels, subgroup a with hemoglobin 40 - 70 g/L, subgroup b with hemoglobin 71 - 101 g/L, subgroup c with hemoglobin of 102 - 132 g/L and subgroup d with hemoglobin more than 133 g/L. Seventeen patients belonged to subgroup b, 12 were grouped in to subgroup a and one each in c and d subgroups.
In subgroup a, the average hemoglobin was 57 g/L and mean plasma cell percentage was 62.54. In subgroup b mean hemoglobin was 84.4 g/L and mean plasma cell percentage was 51.82 (Table 4).
Click to view | Table 4. Variables in the Commonest Myeloma Subgroups |
Applying Pearson’s coefficient correlation it is seen that in both subgroups a strong negative correlation exists between percentage of normoblasts and plasma cells (Table 5). Both hemoglobin and RBC count have only a weak negative correlation with plasma cells.
Click to view | Table 5. Pearsons Coefficient Correlation in Myeloma Subgroups |
| Discussion | ▴Top |
There is extensive literature on the pathogenesis of anemia in myeloma [1-4]. We do not propose to deal with the pathogenesis in this study. We have attempted to study closely the relation between hemoglobin (RBC count and normoblasts) and plasma cell percentage in both patients with and without myeloma. Our findings of a statistically significant negative correlation between hemoglobin (and RBC count) and plasma cells in myeloma are not surprising and are probably due to the replacement of marrow by plasma cells with suppression of erythroid precursors.
However, it is surprising that in the non myeloma group there exists a statistically significant negative correlation (P = 0.023) between marrow normoblast and plasma cell percentage. We could not find a reason for this as none of these patients had evidence of myeloma. Only one of our patients in this group had elevated plasma cell percentage (13%). This was a patient with aplastic anemia. This raises an interesting question as to whether plasma cells affect normoblast percentage with subsequent effect on hemoglobin in both patients with and without myeloma. To answer this question we need to study groups with benign plasmacytosis. In our myeloma subgroups it is not surprising to note that mean plasma cells was higher in subgroup a than b and the mean RBC count and percentage of normoblasts was higher in subgroup b. The interesting fact we noted here is that the mean age in subgroup a (50.63 yrs) was less than subgroup b (58.70). Does this imply that younger patients present with lower hemoglobin levels? Our study group is small to conclude this.
Finally, the students-t-test brings out the surprising finding that though the mean hemoglobin is similar in the myeloma and non myeloma group, there is significant difference between mean RBC counts and normoblast percentage. The average RBC count and normoblast percentage are higher in the non myeloma group and does not explain the reason for the mean hemoglobin being similar in both groups. One of the obvious reasons could be that group 2 includes patients with ineffective erythropoiesis accounting for low hemoglobin levels. This could indirectly imply that ineffective erythropoiesis is not a feature of the myeloma group.
Our study group is small and the groups are not fully sex and age matched to definitely conclude our findings. We need to study larger groups to see if the findings of this study are conclusive.
| References | ▴Top |
- Ludwig H, Pohl G, Osterborg A. Anemia in multiple myeloma. Clin Adv Hematol Oncol. 2004;2(4):233-241.
pubmed - Rokicka-Piotrowicz M, Paszkowska M, Krol M, Kuratowska Z. [Analysis of causes for anemia in patients with multiple myeloma]. Pol Arch Med Wewn. 2000;104(6):843-851.
pubmed - Silvestris F, Tucci M, Quatraro C, Dammacco F. Recent advances in understanding the pathogenesis of anemia in multiple myeloma. Int J Hematol. 2003;78(2):121-125.
pubmed doi - Means RT, Jr., Krantz SB. Progress in understanding the pathogenesis of the anemia of chronic disease. Blood. 1992;80(7):1639-1647.
pubmed - Fossa A, Brandhorst D, Myklebust JH, Seeber S, Nowrousian MR. Relation between S-phase fraction of myeloma cells and anemia in patients with multiple myeloma. Exp Hematol. 1999;27(11):1621-1626.
pubmed doi
This is an open-access article distributed under the terms of the Creative Commons Attribution License, which permits unrestricted use, distribution, and reproduction in any medium, provided the original work is properly cited.
Journal of Hematology is published by Elmer Press Inc.