

| Journal of Hematology, ISSN 1927-1212 print, 1927-1220 online, Open Access |
| Article copyright, the authors; Journal compilation copyright, J Hematol and Elmer Press Inc |
| Journal website https://www.thejh.org |
Original Article
Volume 10, Number 3, June 2021, pages 114-122

Comparative Effectiveness of a Six-Week Treatment Course of Vitamin D2 and D3 in Children With Sickle Cell Anemia in Steady State With Hypovitaminosis D: A Randomized Clinical Trial
Motunrayo Oluwabukola Adekunlea, d ![]() , Adeyemi Oluwaseun Dadab, Fidelis Olisamedua Njokanmac, Adaobi Uzoamaka Solarinc, Barakat Adeola Animasahunc, Moriam Omolola Laminaa
, Adeyemi Oluwaseun Dadab, Fidelis Olisamedua Njokanmac, Adaobi Uzoamaka Solarinc, Barakat Adeola Animasahunc, Moriam Omolola Laminaa
aDepartment of Paediatrics, Lagos State University Teaching Hospital, Ikeja, Lagos, Nigeria
bDepartment of Chemical Pathology, Lagos State University College of Medicine, Ikeja, Lagos, Nigeria
cDepartment of Paediatrics and Child Health, Lagos State University College of Medicine, Ikeja, Lagos, Nigeria
dCorresponding Author: Motunrayo Oluwabukola Adekunle, Department of Paediatrics, Lagos State University Teaching Hospital, 1-5 Oba Akinjobi Lane, Ikeja, Lagos, Nigeria
Manuscript submitted March 14, 2021, accepted April 6, 2021, published online June 16, 2021
Short title: Vitamin D2 and D3 Treatment in Children
doi: https://doi.org/10.14740/jh817
| Abstract | ▴Top |
Background: Correction of vitamin D deficiency through administration of either vitamin D2 or D3 has been shown to reduce chronic bone pains and frequency of acute bone pains, increase bone density as well as improve growth stature in children with sickle cell anemia (SCA). Findings vary on the effectiveness of the two forms of the vitamin. The current study was carried out to compare the effectiveness of a 6-week treatment course of vitamin D2 and D3 in the correction of hypovitaminosis D (vitamin D insufficiency and deficiency) as well as evaluate treatment response to derangement of serum calcium and alkaline phosphatase (ALP) in children with SCA in steady state.
Methods: The study was a randomized, double-blind clinical trial of 174 children with SCA aged 1 - 18 years. Subjects with hypovitaminosis D (baseline serum 25-hydroxyvitamin D (25(OH)D) below 75 nmol/L) were randomized into two treatment arms. Each arm treated either of the two forms of vitamin D had a once weekly dose of 50,000 IU for a period of 6 weeks.
Results: Median rise in serum 25(OH)D after 6 weeks of oral vitamin D2 or D3 was similar between the two groups (median rise in 25(OH)D of 17.8 nmol/L in D2, 15.3 nmol/L in D3 groups). Also, there was no significant difference in the proportion of subjects that improved in their vitamin D status in both treatment arms (P = 0.409). Treatment was significantly associated with increase in proportion of subjects with normal serum calcium (P ≤ 0.001) and decrease in proportion of subjects with elevated serum ALP (P ≤ 0.001).
Conclusion: Once weekly dose (50,000 IU) of either vitamin D supplement has equal effectiveness in correction of hypovitaminosis D. However, vitamin D3 may be cost-effective because it is cheaper.
Keywords: Sickle cell anemia; Hypovitaminosis D; Six-week course; Drug effectiveness; 25(OH)D
| Introduction | ▴Top |
Vitamin D deficiency is a common manifestation in children with sickle cell anemia (SCA). It is five times commoner in children with SCA than children without hemoglobinopathies [1]. Deficiency of vitamin D in affected children leads to acute and chronic bone diseases as well as systemic complications. Apart from vitamin D, other factors that play a role in bone health are calcium, phosphorus and alkaline phosphates [2, 3]. Vitamin D enhances calcium absorption from the gut and facilitates mineralization of bone [4]. Thus, in conditions like SCD associated with deficiency of vitamin D, calcium absorption from the gut is impaired and bone mineralization is compromised [5]. Studies have shown significantly lower calcium levels in persons with SCA compared with healthy controls [6, 7]. Alteration in calcium homeostasis leads to bone mineral diseases [8] and in SCA, bone mineral diseases have been linked to low level of vitamin D [9, 10]. Also, alkaline phosphatase (ALP) is a marker of high bone turnover and it is also associated with bone mineral disorder [11].
Conflicting data on the most effective vitamin D supplement exist in literature. In Nigeria, vitamin D supplementation is not routinely given to children with SCA and no study exists on effectiveness of treatment of hypovitaminosis D in affected individuals as well as evaluation of which of these supplements is more effective in the correction of hypovitaminosis D. This randomized trial was carried to identify which of the two vitamins is more effective in correcting hypovitaminosis D as well as the effect of the treatment on biochemical markers of bone diseases in children with SCA.
| Materials and Methods | ▴Top |
A prospective, randomized, double-blind interventional study was carried out at the Sickle Cell Foundation Centre, Idi-Araba Lagos, Nigeria. Initial pre-treatment study done to identify prevalence of hypovitaminosis D was carried out and has been published. Randomization and pick-up of vitamin D drugs lasted for 2 weeks while treatment of hypovitaminosis D lasted for 6 weeks. The clinical trial was carried out between April and May 2018.
Study population
The study population comprised children with SCA aged 1 - 18 years in steady state who presented at Sickle Cell Foundation Centre and fulfilled the study criteria. Children with hypovitaminosis D as defined by the Endocrine Society Clinical Practice Guideline were recruited for the study [12].
Sample size determination
The study sample size was determined using an appropriate formula in randomized controlled trial (statistical superiority design) [13]. Statistically superiority design was adopted which suggested that vitamin D3 was more effective than vitamin D2 in correcting hypovitaminosis D in subjects.
In the study by Trang et al [14], vitamin D3 and D2 supplements increased serum 25(OH)D by 23.3 ± 15.7 and 13.7 ± 11.4 nmol/L, respectively.
More studies have shown greater efficacy of vitamin D3 compared to vitamin D2 [14-16]; hence, in the present study, vitamin D3 was used as the standard treatment while vitamin D2 as the drug with lesser effectiveness in correction of hypovitaminosis D.
Thus, δ is 23.3 - 13.7 nmol/L = 9.6, S2 = 15.72 + 11.42 = 376.45. Therefore,
Thus, 70 subjects will be recruited into each treatment arm giving a total sample size of 140.
Going by a hypovitaminosis D prevalence rate of 88.5% earlier reported by Abok et al [17], in Nigeria, the number of initial recruits needed to identify 140 vitamin D deficient subjects was derived as follows:
Therefore expected minimum total number of subjects was 156. However, individuals that opted to participate in the study after the desired sample size was met were recruited and their data were also included. In all, 174 subjects were enrolled. To control for the effect of age, subjects screened for hypovitaminosis D were stratified based on age. Overall, recruited subjects according to age strata were: 1 to 5 years = 57, 5 to 10 years = 58, and 11 to 18 years = 59.
Ethical consideration
Assent was also gotten from children 7 years and above. Institutional ethical approval was obtained from Health Research Ethics Committee of the Lagos State University Teaching Hospital, Ikeja, Nigeria (NHREC0/04/2008). Pan African Clinical Trials Registration was done with trial number PACTR201803003160262.
Data collection
Eligibility screening
The Endocrine Society Clinical Practice Guideline definition of vitamin D deficiency was adopted and subjects were classified as either vitamin D sufficiency or hypovitaminosis D (vitamin D deficiency and insufficiency). Vitamin D deficiency is serum 25(OH)D of less than 50 nmol/L (< 20 ng/mL). Vitamin D insufficiency and sufficiency state is 25(OH)D of at least 50 nmol/L but less than 75 nmol/L and at least 75 nmol/L, respectively.
All subjects with serum 25(0H)D below 75 nmol/L (i.e., insufficient and deficient) were eligible and had vitamin D supplements.
Subjects enrollment
At the end of analysis of samples, subjects with vitamin D insufficiency and deficiency with 25(OH)D below 75 nmol/L were selected for treatment with either vitamin D2 or D3.
Randomization
Identical pieces of paper equal in number to subjects found to be deficient in vitamin D were produced. Vitamin D2 was written on half of the number of pieces of paper and vitamin D3 on the remaining half. Each piece of paper was rolled up and all pieces of paper were mixed up in a small basket. The process of randomization was done daily till all eligible subjects that responded to continue with treatment were completed. Two formulations of vitamin D were used, vitamin D2 (ergocalciferol) and vitamin D3 (cholecalciferol) both of which have shown efficacy in earlier studies.
Allocation and concealment
Subjects treated picked randomly from the papers that contained the prescription of the vitamins without revealing what was picked to the investigator. Subjects were directed to a research assistant who is a nurse at the study center who gave the selected vitamin D that was randomly picked to the subjects. The research assistant was someone that was ignorant to the study without any interest in the result. The nurse was provided with a register for serially recording the names of the subjects and the vitamin D that was picked. Caregivers were called weekly to remind them to give the drug to the subjects. To further ensure compliance, the drug for each week was placed in a separate dispensing envelope and each participant had six envelopes for the 6 weeks treatment duration. The caregivers were asked to keep the dispensing envelopes and brought them on the day of post vitamin D assessment. One week after completion of the 6-week treatment, assays of vitamin D, serum calcium and ALP levels were repeated to document response to therapy.
The laboratory scientist who ran the assays was kept ignorant of the identity of the sample: separate serial numbers were given for the post-treatment analysis. At the completion of the study, the investigators collected the register from the nurse in order to match subjects with the vitamin D formulation administered.
Treatment with vitamin D
The Driscol® is the brand of vitamin D2 that was used. This contained 5,000 IU tablets and 10 were prescribed to be taken once on a specific day of the week which could be crushed. Subjects were advised to take the supplement immediately after a meal because absorption is known to be best with food.
For subjects in the vitamin D3 arm of the study, “D3-50” containing 50,000 IU vitamin D3 per capsule was prescribed to be taken once on a specific day of the week. Subjects were advised to take the supplement immediately after a meal because is known to be best absorbed with food.
Adverse effects
Subjects were advised to watch out for and report possible side effects like fatigue, loss of appetite, headache, vomiting, constipation, allergic reaction like itching and rash.
Data analysis
Continuous variables were summarized using mean and standard deviation for normal distribution while median and interquartile range were used for skewed data. Comparison between normally distributed data was carried out using Student’s t-test, Paired t-test and analysis of variance (ANOVA with Bonferroni correction) test while comparison of non-parametric data was done using appropriate non-parametric equivalents (Mann-Whitney test, Wilcoxon signed ranked test or Kruskal-Wallis). Comparison between categorical data was done using Chi-square and Fisher’s exact. Comparison of the proportion of subjects with various vitamin D statuses between baseline and post-treatment was done using McNemar test. Correlation between vitamin D status and anthropometry was achieved using Spearman correlation. Student’s t-test was used to compare vitamin D between the two genders. ANOVA was used to determine the relationship between vitamin D and each of age group and socioeconomic classes.
Potential factors that had significant bivariate relationship with vitamin D were entered into a logistic regression model in order to determine the independent predictors of vitamin D deficiency. Probability value less than 5% (0.05) was considered statistically significant.
| Results | ▴Top |
Figure 1 is a flow chart showing the number of subjects recruited, randomized to either of vitamin D2 or D3 treatment groups and subsequently followed up. Of the 174 subjects, 41 (71.9%) of under 5 years old were allocated to treatment groups. Also, 81.0% and 86.4% of subjects within the age group of 6 to 10 years and 11 years to 18 years respectively were randomized to either vitamin D2 or D3. Out of 148 subjects with hypovitaminosis D, 139 (93.9%) came for and had drug allocation. In all, 69 (59 with vitamin D deficiency, 10 with insufficiency) were assigned to D2 and 70 (60 with vitamin D deficiency, 10 with insufficiency) received D3 respectively. Out of 139 subjects that had drug allocation, 129 (92.8%) (65 subjects that had vitamin D2 and 64 subjects that had vitamin D3) presented for post-treatment vitamin D assessment.
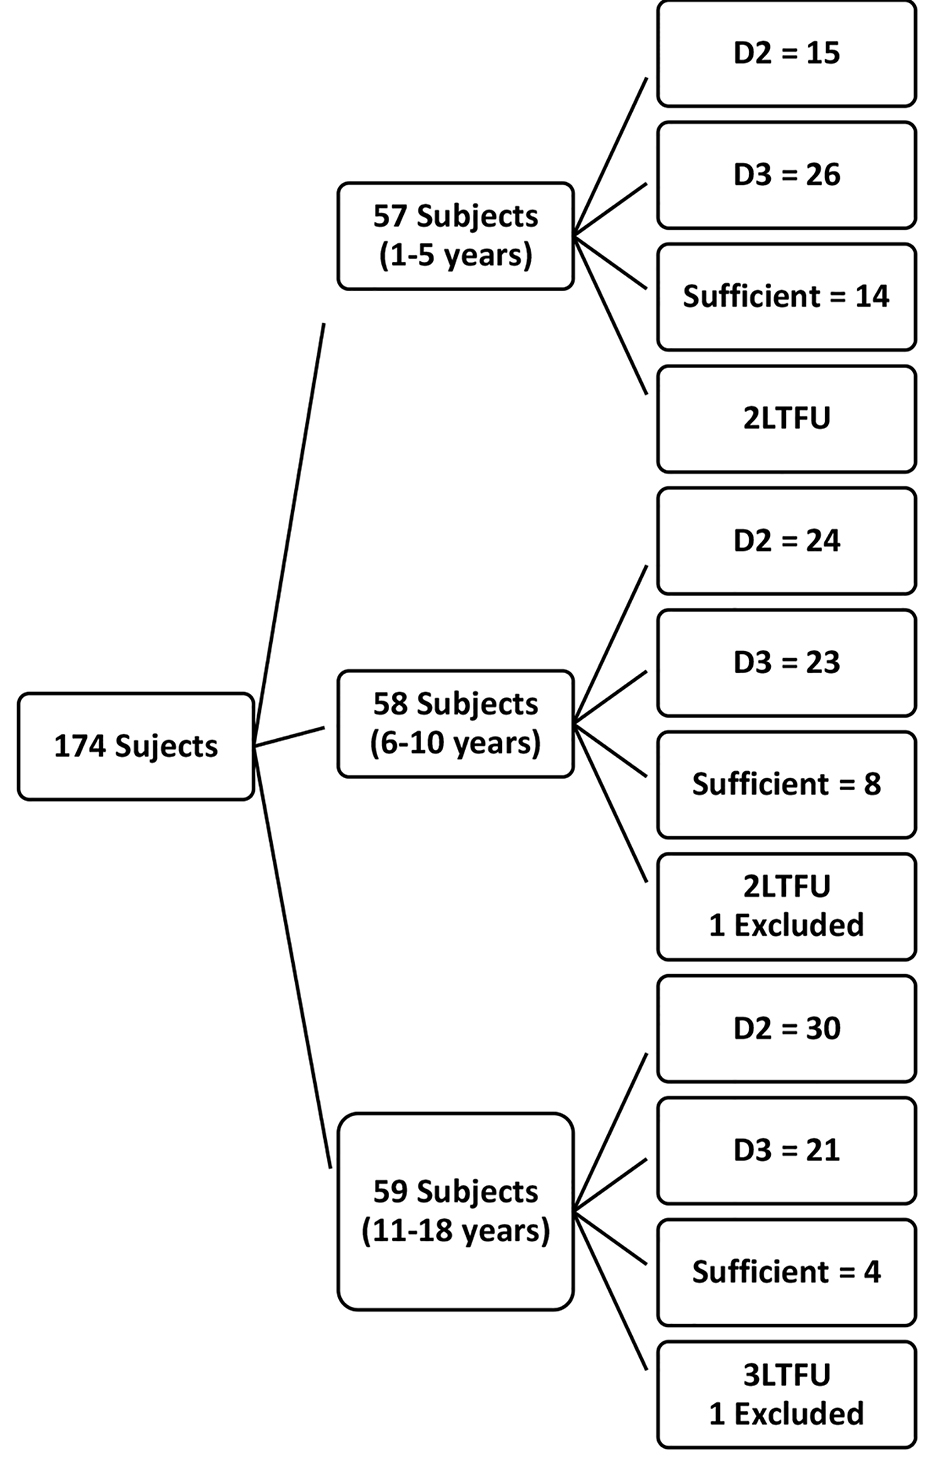 Click for large image | Figure 1. Flow chart of recruited subjects. |
Effect of oral vitamin D on serum 25(OH)D
Altogether, 139 subjects were assigned to treatment groups: 69 had vitamin D2 while 70 had vitamin D3. Of this number, 129 returned for post-treatment evaluation: 65 in the vitamin D2 group and 64 in the vitamin D3 group. As shown in Table 1 no significant difference was noticed in the median values of 25(OH)D in subjects that had vitamin D2 and D3 prior to treatment ((Mann-Whitney U-value = -0.042, P = 0.966). Also, there was no significant difference in the median post-treatment values between the two groups (P = 0.944). In all, 16.53 nmol/L and 9.11 nmol/L median rises were seen in subjects with deficient and insufficient vitamin D (P = 0.044). Also, significant increases in vitamin D levels were observed after 6 weeks of treatment with either vitamin D2 or D3 (Wilcoxon Signed Rank P-value ≤ 0.001 in each case).
 Click to view | Table 1. Comparison of the Effects of Oral Vitamin D2 and D3 on Serum 25(OH)D |
Figure 2 shows the median rise in serum 25(OH)D post-treatment in the two groups. Increases of 17.81 nmol/L and 15.3 nmol/L were observed with vitamin D2 and D3 treatment, respectively. There was no significant difference between the observed increases (Mann-Whitney U-value = -0.26, P = 0.765).
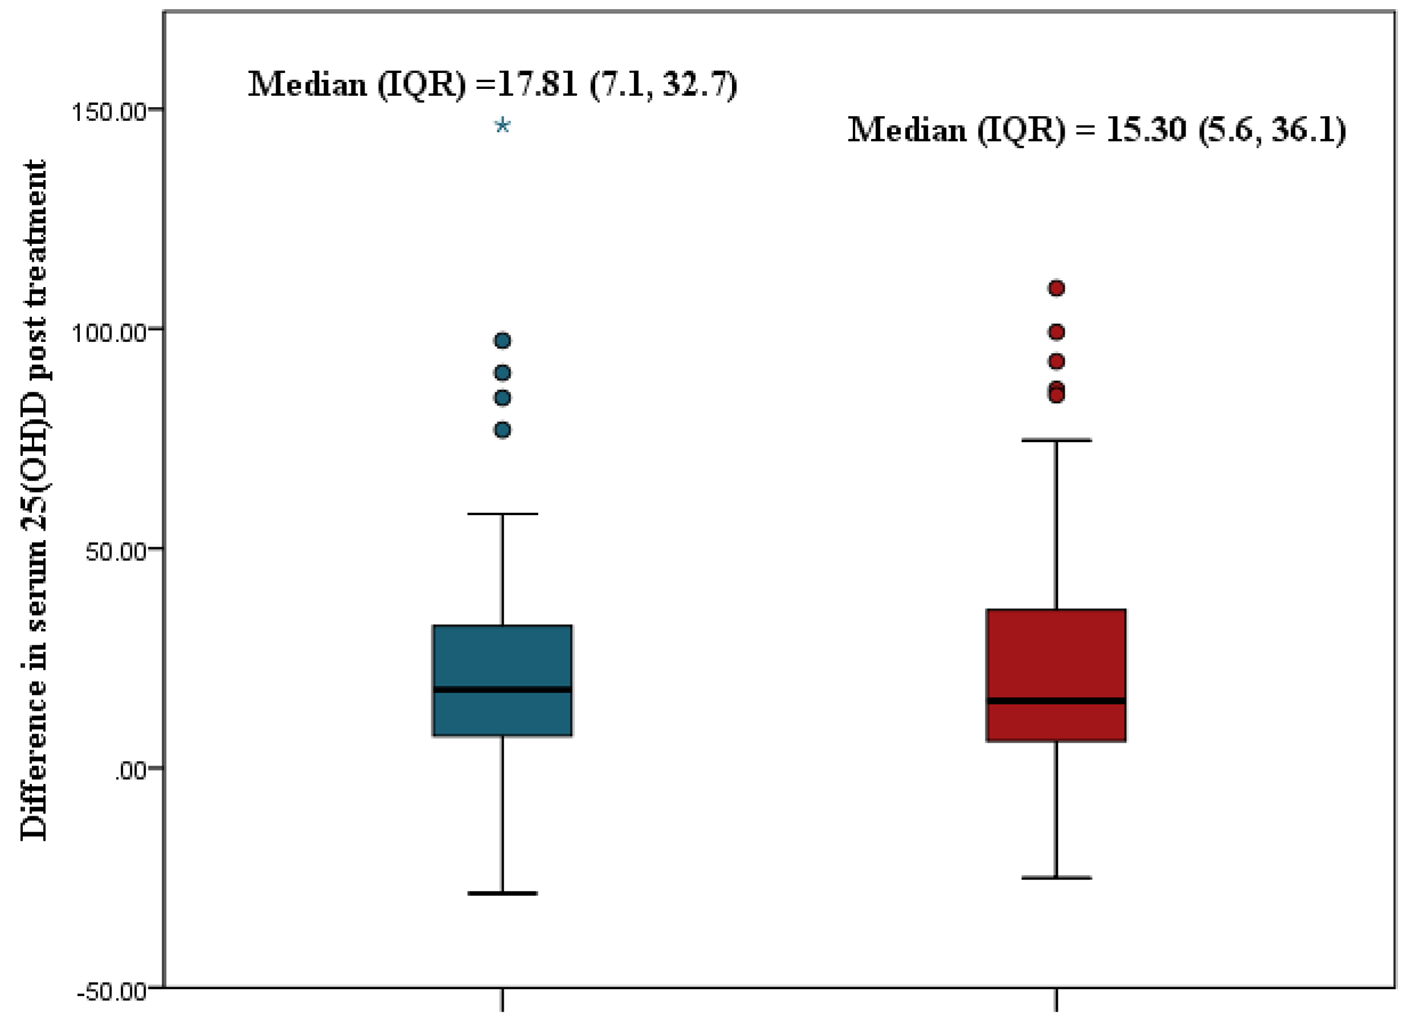 Click for large image | Figure 2. Comparison of median rise in serum 25(OH)D between oral vitamin D2 and D3. 25(OH)D: 25-hydroxyvitamin D. |
Table 2 shows the median change in serum 25(OH)D according to age, sex and socioeconomic class. A global Kruskal-Wallis test showed a significant difference across the three age group (P = 0.017) with subjects under 5 years old experiencing the highest increase in median serum vitamin D. Post hoc analysis showed that subjects under 5 years old experienced a significantly higher rise in serum vitamin D level than subjects aged 11 to 18 years (P ≤ 0.001). No significant difference was found between males and females (P = 0.665) or among the socioeconomic classes (P = 0.761).
Click to view | Table 2. Association Between Change in Serum 25(OH)D and Sociodemographic Characteristics |
Table 3 shows the treatment-associated change in median serum vitamin D levels associated with various nutritional indices. Normal subjects did not differ significantly from subjects with low weight-for-length (P = 0.403), low weight-for-age (P = 0.545), low height-for-age (P = 0.057) or subjects with abnormal body mass index (BMI) (P = 0.85).
Click to view | Table 3. Association Between Change in Serum 25(OH)D and Nutritional Status |
Altogether, 66 (51.2%) subjects experienced an improvement in vitamin D status 6 weeks after treatment: 35 in the D2 arm and 31 in the D3 arm. The proportions with improved vitamin D status were similar in the two groups (53.8% vs. 48.4%, χ2 = 0.682, P = 0.409). Table 4 shows the proportion of subjects who improved from deficient to insufficient, from deficient to sufficient or remained deficient. It also shows the proportion that improved from insufficient to sufficient or remained insufficient. The information is shown for the two treatment groups.
Click to view | Table 4. Classification of Subjects Based on Response to Vitamin D Therapy |
The table shows that a higher proportion of subjects with vitamin D deficiency became sufficient in the D3 treatment arm but the difference was not statistically significant (20 (31.2%), 11 (16.9%), P = 0.411). A significantly higher proportion of subjects in D2 treatment arm went from deficient to insufficient (P = 0.007). A higher proportion of subjects improved from insufficient to sufficient in the D3 treatment arm than in the D2 arm but the difference was not statistically significant ( Fisher exact, P = 0.65). Thirty-two subjects in the total cohort had severe vitamin D deficiency ((25OH)D below 30 nmol/L) at baseline. Out of these 32 subjects, three (8.33%) remained severely deficient. Decline from baseline 25(OH)D with no change in vitamin D status was seen in five (7.69%) and three (4.69%) subjects that had vitamin D2 and D3, respectively.
Effect of serum vitamin D on serum calcium level
Table 5 shows the mean baseline and post-treatment serum calcium levels in the treatment groups. Pre-intervention levels were similar in both treatment groups (t = 0.735; P = 0.464). Post-intervention levels were also similar in both groups (t = 0.733; P = 0.465).
Click to view | Table 5. Comparison of Serum Calcium Levels Before and After Intervention Between the Treatment Groups |
In subjects allocated to oral D2, mean rise in corrected serum calcium was 0.098 ± 1.50 (confidence interval (CI) = -0.289, 0.487, t = 0.507, P = 0.614). In the vitamin D3 group, mean rise was 0.373 ± 0.712, t = 2.210, P = 0.031). Paired t-test analysis however showed no significant change between pre-treatment and post-treatment values in any of the groups (paired t = 0.507; P = 0.474 and paired t = 2.21; P = 0.067 in the D2 and D3 groups, respectively).
Of the 129 subjects who were assigned to treatment groups, 64 (49.6%) had pre-treatment hypocalcemia. This number reduced to 27 (20.9%) after treatment with vitamin D. Thus there was a 28.7% reduction in subjects with hypocalcemia after 6 weeks of supplementation with vitamin D from 49.6% to 20.9% (P < 0.001). Out of 37 subjects with hypocalcemia that had normal calcium post-treatment, 16 (43.2%) had vitamin D2 while 21 (56.7%) were treated with D3 (P = 0.201).
Effect of oral vitamin D on serum ALP
A significant reduction in the serum ALP in the treatment groups was seen in each treatment arm. A significant decline in proportion of subjects with high serum ALP (40, 31.0%) to 13 (10.1%) was observed. Also, increase in proportion of subjects with normal/low serum ALP from 89 (69.0%) to 116 (89.9%) was seen (P ≤ 0.001).
Table 6 shows the mean baseline and post-treatment serum ALP levels in the treatment groups. Pre-intervention levels were similar in both treatment groups (Mann-Whitney U test = -0.316; P = 0.752). Post-intervention levels were also similar in both groups (U = -0.606; P = 0.544).
Click to view | Table 6. Serum Alkaline Phosphatase Levels Before and After Intervention |
In subjects allocated to oral D2, median decline in serum ALP was -59.9 (Wilcoxon signed rank test, t = -4.433, P ≤ 0.001). In the vitamin D3 group, median decline in serum ALP was -70.8 (Wilcoxon signed rank, t = -5.688, P ≤ 0.001).
Adverse outcomes
Two (1.55%) subjects reported any form of adverse effect associated with or presumed to be associated with administration of vitamin D supplements. One subject complained of nausea which was described as transient after ingestion of the medicine and was experienced about three occasions within the first 1 week. The symptom resolved spontaneously thereafter. The second patient complained of an episode of abdominal pain which resolved with oral ibuprofen administered by the mother.
| Discussion | ▴Top |
In the early pre-treatment analysis reported by the authors, prevalence of vitamin D deficiency was 72.5% and only 14.9 subjects had sufficient vitamin D [18]. Randomization and treatment with vitamin D was done according to World Health Organization (WHO) standard. High dose once a week vitamin D2 or D3 was administered for 6 weeks adopted in the current study has been recommended by the Endocrine Society’s Clinical Guideline [12]. This treatment option was chosen to ensure compliance and reduce loss to follow-up which was shown to be effective in our cohort with more than 90% participants completing the study.
Pre-treatment baseline serum 25(OH)D in the two groups were similar in our cohort. This makes comparison to treatment feasible. A main finding in the current study was that both forms of vitamin D (D2 and D3) showed similar effectiveness in raising serum 25(OH)D levels. This is in agreement with earlier studies [19, 20]. However, some authors have reported D3 to be more effective than D2 [14, 21, 22]. Unlike the current study that recruited a relatively large sample size, two earlier studies by Heaney et al [21] and Armas et al [22] were characterized by small sample sizes (total sample sizes of less than 35 subjects), a factor which can result in exaggeration of effect size. In addition, the current study had a similar baseline 25(OH)D in contrast to Heaney and co-workers [21] where baseline serum 25(OH)D in subjects that had D3 was lower than those treated with D2. It is plausible to assume that the randomization process in the current study may have corrected bias more adequately than the study by Heaney et al [21]. With respect to vitamin D, it is important that the baseline values in the treatment groups are similar because it is known that the lower the baseline of 25(OH)D in any treatment group, the higher the rise from baseline in that treatment group. Negative feedback to hepatic hydroxylation and synthesis of active 1,25-dihydroxycholecalciferol in the kidneys have been postulated as possible reasons for higher response to treatment in subjects with lower baseline 25(OH)D [23]. Thus, the relatively higher effect in the vitamin D3 may be due to lower baseline 25(OH)D levels rather than a superior effect of the vitamin D3.
Also, Trang and co-researchers [14] reported a superior effectiveness of vitamin D3 compared to D2 utilized an unbalanced randomization of the study subjects (1:3) in addition to using sample size that was not adequate for such allocation ratio. It is known that for the finding of a clinical trial to be valid unequal randomization requires large sample size compared to balanced allocation of subjects into the study arms. Thus, the unequal allocation ratio may have biased the study towards exaggerating an effect size.
When compared with the finding of an earlier study of North American children with SCA by Gordon et al [20], the degree of rise in serum 25(OH)D from baseline in response to vitamin D was lower in the current study (68 nmol/L vs. 15 nmol/L). This was despite similar baseline 25(OH)D, strength, formulation, dose and duration of therapy. Whereas the index study recruited children aged 1 to 18 years, the North American study recruited children only less than 2 years of age. It is known that younger age group responds better to vitamin D supplementation as earlier explained. Reasons attributable for wide variation in the degree of rise from the baseline 25(OH)D between the current study and previous studies [19, 22] include differences in age ranges, strength of formulation, duration of treatment and frequency of administration.
Although only a quarter of the subjects had normal serum vitamin D post-treatment, a subgroup analysis revealed that 90% of the subgroup of the total cohort with severe vitamin D deficiency (serum 25(OH)D below 30 nmol/L) improved to at least a deficient state (serum 25(OH)D ≥ 30 nmol/L ). This may suggest that given longer time on vitamin D therapy, this group and indeed other categories of deficient levels may improve in their vitamin D levels. Earlier reports did not express the effect of vitamin D therapy in SCA subjects in terms of the proportion of subjects that showed improvement in their vitamin D status [14, 20, 21]. Rather, effectiveness was determined using mean or median rise in serum 25(OH)D from baseline. The current study however, evaluated effectiveness of vitamin D therapy in terms of median rise from baseline as well as the proportion of subjects that improved in response to therapy. Hence, comparison could not be made in terms of proportion of subjects that showed improvement in their vitamin D status with earlier studies.
The current study observed that weekly oral vitamin D was effective in the treatment of hypovitaminosis D as it resulted in about 52% increase in 25(OH)D from baseline values. The advantage in the use of a weekly oral preparation, rather than daily dosage is that compliance to a weekly-administered medication is likely to be better than that of a daily-administered one. Also, the costs of vitamin D2 (ergocalciferol) and D3 (cholecalciferol) per patient for the 6-week treatment were 4 dollars and 1.8 dollars, respectively. Since the two forms of vitamin D showed comparable effectiveness, vitamin D3 might be considered as a more cost-effective formulation in resource-poor countries like Nigeria.
The finding of a better response to vitamin D treatment in the younger age groups as was observed in the current study agree with previous reports [14, 24-26]. This has been attributed to the fact that similar doses were administered across all the age groups in all the studies, thus younger subjects received a larger amount per unit body size compared to the older ones. Hence, some authors have proposed the need for weight adjusted dose [27]. Administration of oral vitamin D resulted in corresponding increase in serum calcium and decline in ALP in our cohort. Similar responses to vitamin D treatment were noticed in both treatment groups. A similar response in serum calcium to vitamin D therapy was reported by Soliman et al [28]. This finding is not surprising because active 1,25-dihydroxyvitamin D stimulates active intestinal absorption of calcium [29]. The finding of a significantly higher proportion of number of subjects that had a decrease in serum ALP has also been previously reported. This implies that treatment of hypovitaminosis D effectively reduces bone turnover.
No serious adverse effect to treatment was noticed in our study. All side effects were transient. This buttresses the efficacy and safety of high dose of vitamin D in children with SCA complicated by hypovitaminosis D.
In conclusion, oral administration of vitamin D2 or D3 is equally effective in correction of hypovitaminosis D. Also, administration of vitamin D resulted in significant increase in proportion of participants with normal serum calcium and reduction in serum ALP.
Limitation
This study limitation includes inability to follow up participants for a longer duration to identify any late effect to treatment. Bone marrow density may have provided a clinical surrogate of vitamin D deficiency but was excluded in the current study due to cost implications. Also, renal function assessment was not done in the study subjects. Subjects allocated to vitamin D2 had to take tablets (10) due to unavailability of 50,000 IU strength. The fact that the formulation was tablets however made it easy for caregivers to crush and administer, thereby controlling for difficulty in usage and non-compliancy.
Acknowledgments
The authors acknowledge the assistance of staff of Sickle Cell Foundation Centre, Idi-Araba during the recruitment of the participants of this study. The willingness and participation of all children in this study as well as that of their caregivers is acknowledged.
Financial Disclosure
The study was sponsored by all the authors.
Conflict of Interest
No conflict of interest among the authors.
Informed Consent
Written informed consent was obtained from all caregivers.
Author Contributions
MOA, OFN, AUS: conception and study design; MOA: data collection; MOD: data analysis; MOA, BAA, MOL: data interpretation. All authors participated in manuscript review.
Data Availability
The authors declare that data supporting the findings of this study are available within the article.
Abbreviations
SCA: sickle cell anemia; 25(OH)D: 25-hydroxyvitamin D; WHO: World Health Organization
| References | ▴Top |
- Rovner AJ, Stallings VA, Kawchak DA, Schall JI, Ohene-Frempong K, Zemel BS. High risk of vitamin D deficiency in children with sickle cell disease. J Am Diet Assoc. 2008;108(9):1512-1516.
doi pubmed - Peacock M. Calcium metabolism in health and disease. Clin J Am Soc Nephrol. 2010;5(Suppl 1):S23-30.
doi pubmed - Mohammed S, Addae S, Suleiman S, Adzaku F, Annobil S, Kaddoumi O, Richards J. Serum calcium, parathyroid hormone, and vitamin D status in children and young adults with sickle cell disease. Ann Clin Biochem. 1993;30(Pt 1):45-51.
doi pubmed - Spencer M, Wong RY. The role of vitamin D in bone metabolism and beyond. CGS J C. 2014;4(7):13-17.
- Chapelon E, Garabedian M, Brousse V, Souberbielle JC, Bresson JL, de Montalembert M. Osteopenia and vitamin D deficiency in children with sickle cell disease. Eur J Haematol. 2009;83(6):572-578.
doi pubmed - Oladipo OO, Temiye EO, Ezeaka VC, Obomanu P. Serum magnesium, phosphate and calcium in Nigerian children with sickle cell disease. West Afr J Med. 2005;24(2):120-123.
doi pubmed - Nduka N, Kazem Y, Saleh B. Variation in serum electrolytes and enzyme concentrations in patients with sickle cell disease. J Clin Pathol. 1995;48(7):648-651.
doi pubmed - Adewoye AH, Chen TC, Ma Q, McMahon L, Mathieu J, Malabanan A, Steinberg MH, et al. Sickle cell bone disease: response to vitamin D and calcium. Am J Hematol. 2008;83(4):271-274.
doi pubmed - Sadat-Ali M, Al-Elq A, Al-Turki H, Sultan O, Al-Ali A, AlMulhim F. Vitamin D level among patients with sickle cell anemia and its influence on bone mass. Am J Hematol. 2011;86(6):506-507.
doi pubmed - Arlet JB, Courbebaisse M, Chatellier G, Eladari D, Souberbielle JC, Friedlander G, de Montalembert M, et al. Relationship between vitamin D deficiency and bone fragility in sickle cell disease: a cohort study of 56 adults. Bone. 2013;52(1):206-211.
doi pubmed - Park JC, Kovesdy CP, Duong U, Streja E, Rambod M, Nissenson AR, Sprague SM, et al. Association of serum alkaline phosphatase and bone mineral density in maintenance hemodialysis patients. Hemodial Int. 2010;14(2):182-192.
doi pubmed - Holick MF, Binkley NC, Bischoff-Ferrari HA, Gordon CM, Hanley DA, Heaney RP, et al. Evaluation, treatment, and prevention of vitamin D deficiency: an endocrine society clinical practise guideline. JCEM. 2011;96(7):1-20.
doi pubmed - Zhong B. How to calculate sample size in randomized controlled trial? J Thorac Dis. 2009;1(1):51-54.
- Trang HM, Cole DE, Rubin LA, Pierratos A, Siu S, Vieth R. Evidence that vitamin D3 increases serum 25-hydroxyvitamin D more efficiently than does vitamin D2. Am J Clin Nutr. 1998;68(4):854-858.
doi pubmed - Wykes C, Arasaretnam A, O'Driscoll S, Farnham L, Moniz C, Rees DC. Vitamin D deficiency and its correction in children with sickle cell anaemia. Ann Hematol. 2014;93(12):2051-2056.
doi pubmed - Hartwell D, Hassager C, Christiansen C. Effect of vitamin D2 and vitamin D3 on the serum concentrations of 1,25(OH)2D2, and 1,25(OH)2D3 in normal subjects. Acta Endocrinol (Copenh). 1987;115(3):378-384.
doi pubmed - Abok I, Kaida K, Okolo S. Prevalence of vitamin D deficiency in sickle cell anaemia children in Jos, Nigeria. ESPE.2015;84:650.
- Adekunle MO, Njokanma OF, Solarin AU, Dada AO, Animasahun BA, Ubuane P. Prevalence and risk factors of hypovitaminosis D in Nigerian children with sickle cell anaemia. Annals of Health Research. 2020;6(4):410-420.
doi - Holick MF, Biancuzzo RM, Chen TC, Klein EK, Young A, Bibuld D, Reitz R, et al. Vitamin D2 is as effective as vitamin D3 in maintaining circulating concentrations of 25-hydroxyvitamin D. J Clin Endocrinol Metab. 2008;93(3):677-681.
doi pubmed - Gordon CM, Williams AL, Feldman HA, May J, Sinclair L, Vasquez A, Cox JE. Treatment of hypovitaminosis D in infants and toddlers. J Clin Endocrinol Metab. 2008;93(7):2716-2721.
doi pubmed - Heaney RP, Recker RR, Grote J, Horst RL, Armas LA. Vitamin D(3) is more potent than vitamin D(2) in humans. J Clin Endocrinol Metab. 2011;96(3):E447-452.
doi pubmed - Armas LA, Hollis BW, Heaney RP. Vitamin D2 is much less effective than vitamin D3 in humans. J Clin Endocrinol Metab. 2004;89(11):5387-5391.
doi pubmed - Barger-Lux MJ, Heaney RP, Dowell S, Chen TC, Holick MF. Vitamin D and its major metabolites: serum levels after graded oral dosing in healthy men. Osteoporos Int. 1998;8(3):222-230.
doi pubmed - Andersson B, Swolin-Eide D, Magnusson P, Albertsson-Wikland K. Vitamin D status in children over three decades - Do children get enough vitamin D? Bone Rep. 2016;5:150-152.
doi pubmed - Zittermann A, Ernst JB, Gummert JF, Borgermann J. Vitamin D supplementation, body weight and human serum 25-hydroxyvitamin D response: a systematic review. Eur J Nutr. 2014;53(2):367-374.
doi pubmed - Zhao LJ, Zhou Y, Bu F, Travers-Gustafson D, Ye A, Xu X, Hamm L, et al. Factors predicting vitamin D response variation in non-Hispanic white postmenopausal women. J Clin Endocrinol Metab. 2012;97(8):2699-2705.
doi pubmed - McNally JD, Iliriani K, Pojsupap S, Sampson M, O'Hearn K, McIntyre L, Fergusson D, et al. Rapid normalization of vitamin D levels: a meta-analysis. Pediatrics. 2015;135(1):e152-166.
doi pubmed - Soliman AT, El-Dabbagh M, Adel A, Al Ali M, Aziz Bedair EM, Elalaily RK. Clinical responses to a mega-dose of vitamin D3 in infants and toddlers with vitamin D deficiency rickets. J Trop Pediatr. 2010;56(1):19-26.
doi pubmed - Lips P. Interaction between vitamin D and calcium. Scand J Clin Lab Invest Suppl. 2012;243:60-64.
This article is distributed under the terms of the Creative Commons Attribution Non-Commercial 4.0 International License, which permits unrestricted non-commercial use, distribution, and reproduction in any medium, provided the original work is properly cited.
Journal of Hematology is published by Elmer Press Inc.